
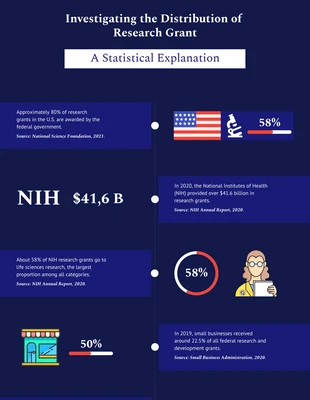
Statistical Explanation Research Infographic Template
Unleash Your Creativity: Design Your Own Statistical Research Infographic Today!
 100% customizable templates
 Millions of photos, icons, charts and graphics
 AI-powered editing features
 Effortlessly share, download, embed and publish
 Easily generate QR codes for your designs
- SizeTabloid (11 x 17 in)
- File typePNG, PDF, PowerPoint
- Planfree
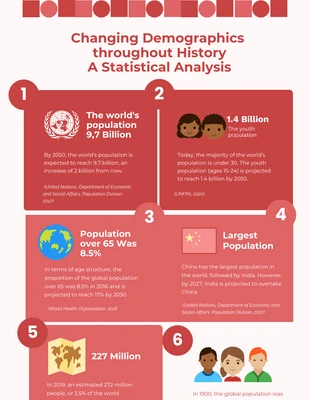
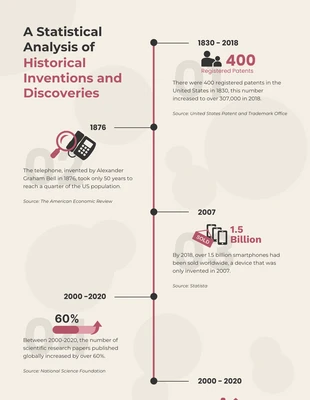
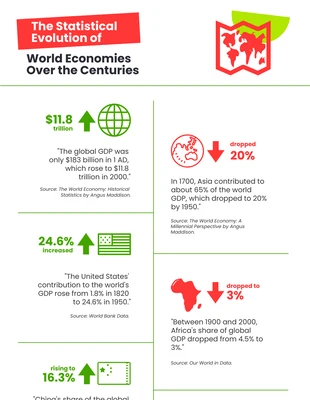
Increase engagement and comprehension with our Simple Statistical Explanation Research Infographic Template. This design's streamlined layout and sophisticated look are perfect for distilling complex data into digestible information. Whether it's for a sales report or a technical analysis, this template will make your data visually compelling and easy to understand. Best of all, you can fine-tune it to your needs. Add your choice of colors, adjust sizes, or select from our vast free stock libraries to incorporate eye-catching images or icons. Make your statistics stand out in the crowd and entice readers. With Venngage, crafting your ideal infographic is made simple, giving you every opportunity to promote and get your message out there!
Explore more
- Research
Related infographics
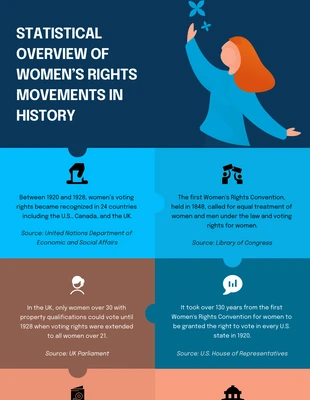
history infographics
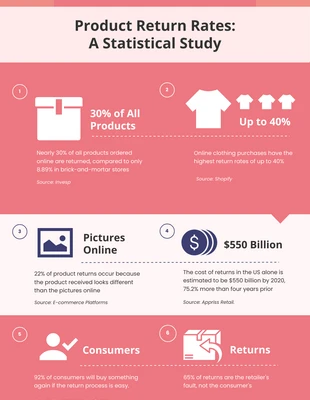
product infographics
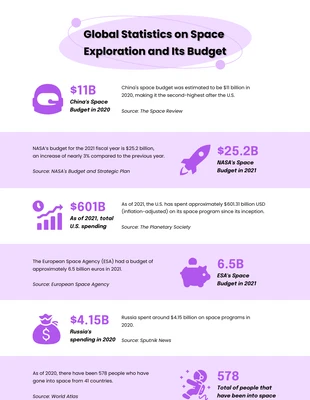
science infographics
research infographics
history infographics
history infographics
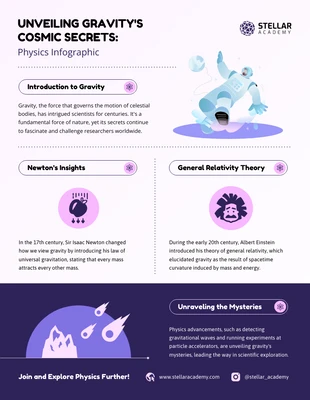
physics infographics
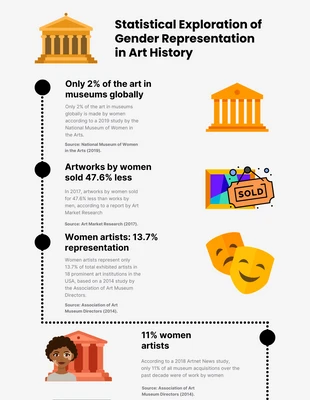
art infographics
history infographics
photography infographics
research infographics

research infographics