
Scientific Infographic Template
Scientific infographics are used to visually communicate and inspire scientific ideas. Create your own scientific infographic using this Venngage template.

 100% customizable templates
 Millions of photos, icons, charts and graphics
 AI-powered editing features
 Effortlessly share, download, embed and publish
 Easily generate QR codes for your designs
- Design stylemodern
- Colorslight
- SizeLetter (8.5 x 11 in)
- File typePNG, PDF, PowerPoint
- Planfree
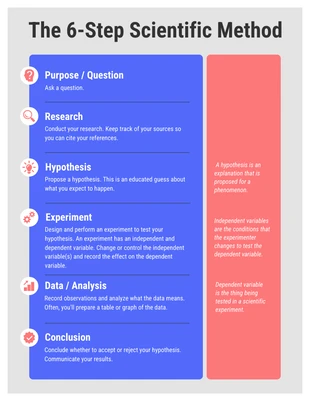
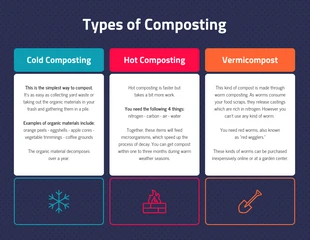
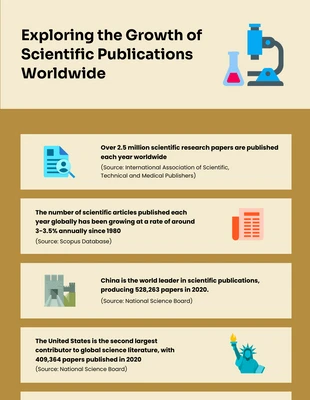
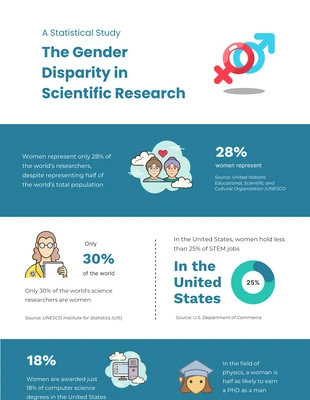
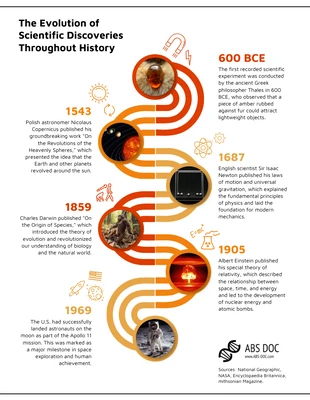
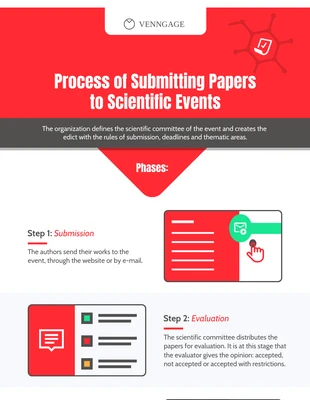
A scientific infographic is a graph, chart or diagram used to visually communicate scientific information. Scientific infographics are used for a variety of purposes, including helping users understand complex scientific phenomena, communicating research findings and results to the public, and helping students learn about a subject. This type of visual content can be used in many different situations. For example, scientists may create an infographic as part of a research proposal or as part of their final report. Similarly, educators can use infographics in classrooms to teach students about new concepts or to explain existing ones. Students may also create infographics as part of a project; these may be displayed on the classroom bulletin board or shared with other teachers via email or social media sites like Twitter or Facebook. Whether you want to get started right away or take your time, we offer a free membership that will give you access to our simple design tool. Our editor gives full control over how the final product looks—from fonts and icons all the way down to color palette and content. To make
Related Infographic Templates
process infographics
mental health infographics
informational infographics
science infographics
comparison infographics
science infographics
research infographics
science infographics
process infographics
informational infographics
science infographics
informational infographics