
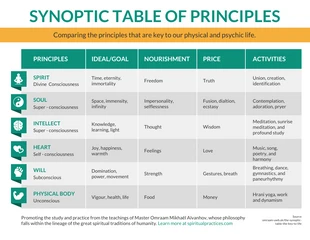
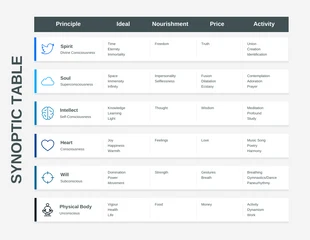
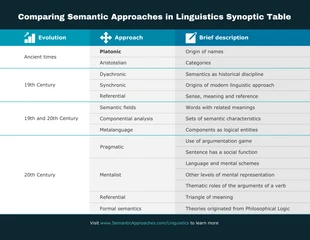
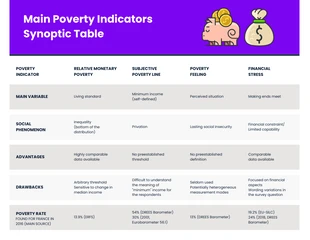
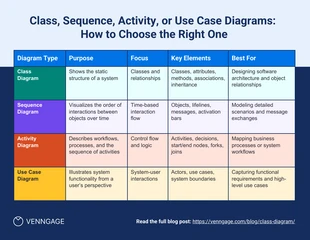
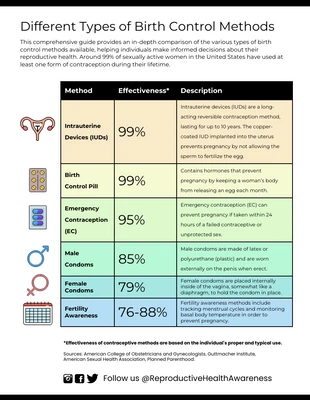
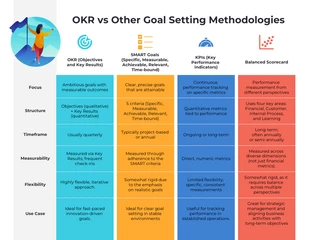
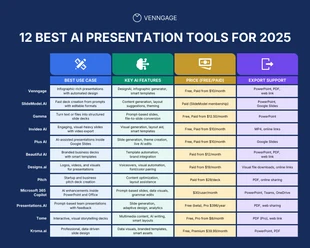
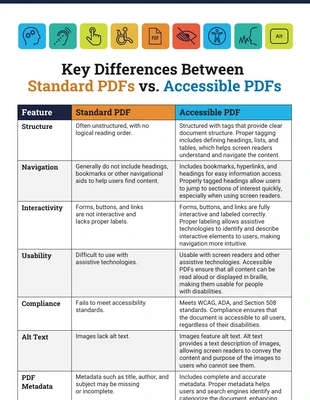
Main Poverty Indicators Synoptic Table Infographic Template
Create a bold synoptic table and more by editing this Main Poverty Indicators Synoptic Table Infographic Template

 100% customizable templates
 Millions of photos, icons, charts and graphics
 AI-powered editing features
 Effortlessly share, download, embed and publish
 Easily generate QR codes for your designs
- Design stylevintage
- Colorslight
- SizeLetter (11 x 8.5 in)
- File typePNG, PDF, PowerPoint
- Planfree
Make an eye-catching synoptic table and more with this customizable Main Poverty Indicators Synoptic Table Infographic Template. Incorporate a dramatic color palette, utilize bold headings, and insert images to make it more interesting. Whether comparing poverty indicators or science, the template is easy to personalize in minutes. If you want to make the synoptic table more vivid, pick a dramatic color palette. The dramatic colors will instantly grab attention and Venngage has a large variety of color palettes to choose from. You can also opt to make a new color scheme from scratch, or choose an entirely different color palette that suits your needs. After you've added your own text, apply bold headings so they stand out over the body content. Bold headings are also a great way to show where new sections or categories begin. Finish up by adding a couple images that relate to the Main Poverty Indicators Synoptic Table Infographic Template. There are thousands of quality stock images available that will help transform your infographic. Start editing your very own synoptic table infographic today!
Related Infographic Templates
comparison infographics
health infographics
mountain infographics
math infographics
comparison infographics
 1/2
1/2comparison infographics
comparison infographics
comparison infographics
comparison infographics
comparison infographics
comparison infographics
comparison infographics