
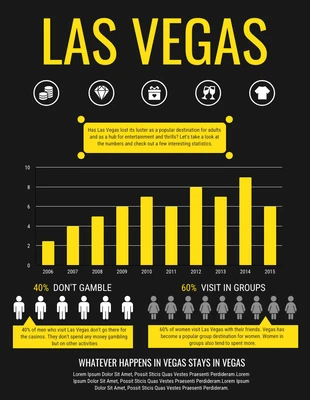
Las Vegas Infographic Template
What happens in Vegas, stays in Vegas! Get the facts out there with this editable Las Vegas Statistical Infographic Template

 100% customizable templates
 Millions of photos, icons, charts and graphics
 AI-powered editing features
 Effortlessly share, download, embed and publish
 Easily generate QR codes for your designs
- Design stylemodern
- Colorsdark
- SizeLetter (8.5 x 11 in)
- File typePNG, PDF, PowerPoint
- Planpremium
Develop an outstanding statistical infographic and more with this Las Vegas Statistical Infographic Template. Edit the infographic with a chart, icons, and a dramatic color palette so it's easily noticeable. Start off customizing the statistical infographic with a chart that successfully communicates the data. Venngage has a vast collection of charts you can select from and you can easily upload a file and watch the data transform into the chart. Next, apply icons to the Las Vegas Statistical Infographic Template so the statistics are more exciting to read. You can easily search the Venngage gallery for icons that fit with your content and then insert them into the data infographic. Complete the Las Vegas Statistical Infographic Template by choosing a dramatic color palette that will captivate your audience. Select one of the pre-made color schemes on Venngage, or make your own dramatic color palette for the statistical infographic. Not quite the infographic you were looking for? Browse Venngage for more impressive statistical infographic templates!
Related Infographic Templates
informational infographics
informational infographics
statistical infographics
informational infographics