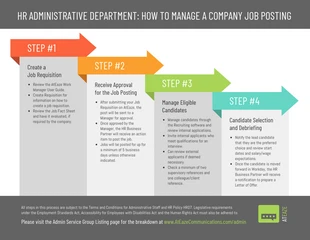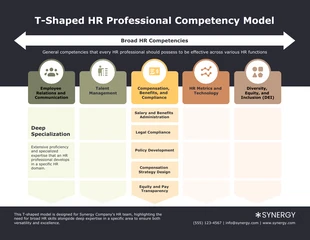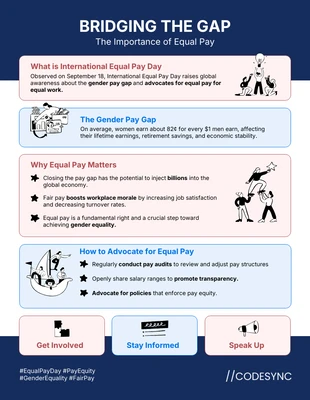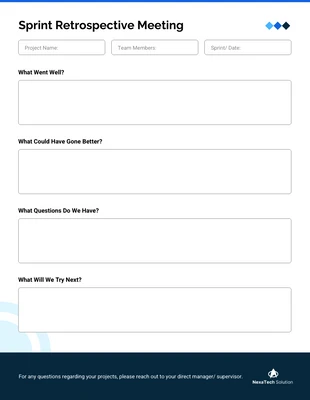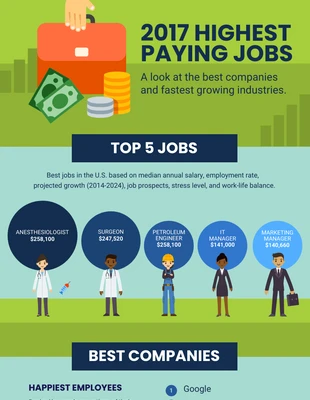
Highest Paying Jobs Career Infographic Template
Dive deep into a topic with the Careers Infographic Template!
100% customizable templates
Millions of photos, icons, charts and graphics
AI-powered editing features
Effortlessly share, download, embed and publish
Easily generate QR codes for your designs
- Design stylemodern, fun
- Colorsvibrant
- SizeCustom (816 x 2000 px)
- File typePNG, PDF, PowerPoint
- Planbusiness
With the Careers Infographic Template, you can tell a multifaceted story. Create a number of different sections to simplify each of your points. Use icons to create captivating images and charts to engage your audience. Explore insights into any topic, sector or industry and communicate your thoughts with wonderfully illustrated icons. Search our vast 20,000+ icon library by term or browse by category, to find the right icons for you. You can even combine icons to create more detailed illustrations and backgrounds! You can tell a data-driven story with the right icons and shapes. Use different-sized circles or circles of different shades to convey varying intensity. You can use bars of different heights to capture the rise or decline of trends. Use other shapes and colors to create your own settings for your visual story. Did you enjoy your Venngage design experience? Tell us how it went and what we can do to make it even better!

