
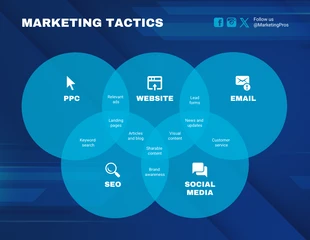
Overlapping Circle Pie Chart Diagram Template
Customize, design, and edit this 'Marketing Tactics' Venn diagram template to visualize key strategies like PPC, SEO, and Social Media. With overlapping blue circles and a sleek layout, it's perfect for marketing presentations and planning. Ideal for marketers and teams. Explore more customizable diagram templates on Venngage to meet your marketing objectives.

 100% customizable templates
 Millions of photos, icons, charts and graphics
 AI-powered editing features
 Effortlessly share, download, embed and publish
 Easily generate QR codes for your designs
- Design stylemodern
- Colorsdark
- SizeLetter (11 x 8.5 in)
- File typePNG, PDF, PowerPoint
- Planpremium
An overlapping circle chart template is a type of graph that visually communicates the overlapping of data from two different data sets. In this type of graph, the overlapping circles represent two overlapping datasets. One overlapping circle represents the overlapping data in one dataset, while another overlapping circle represents overlapping data in the second dataset. An overlapping circle chart template can be seen as accurate when representing overlapping data because overlapping is accurately represented by the overlapping of the circles rather than placing the overlapping sections in one single piece. An overlapping circle chart template is most commonly seen in financial charts depicting overlapping data on a budget graph or overlapping data of two different departments, with one overlapping circle representing the overlapping of the same types of information from each department. Venngage offers a very simple overlapping circle chart template that allows you to create custom overlapping circle charts and download them as png or svg files. Create an overlapping circle chart with Venngage's overlapping circle chart template. This overlapping circle chart template may be customized without any
Related Diagram Templates
venn diagram diagrams

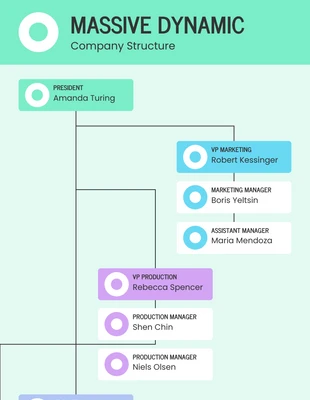
organizational diagrams
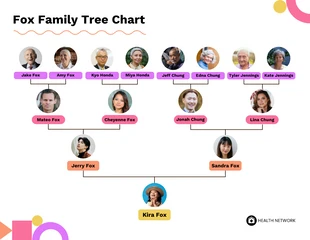
family tree diagrams

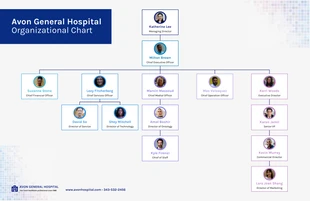
organizational diagrams
organizational diagrams

venn diagram diagrams
organizational diagrams
organizational diagrams

organizational diagrams

organizational diagrams
organizational diagrams
family tree diagrams