
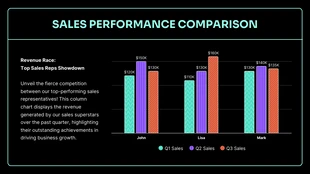
Sales Performance Analysis Histogram Template
Unleash your creativity! Design your very own Sales Performance Analysis Histogram Chart now.
 100% customizable templates
 Millions of photos, icons, charts and graphics
 AI-powered editing features
 Effortlessly share, download, embed and publish
 Easily generate QR codes for your designs
- SizeCustom (1024 x 576 px)
- File typePNG, PDF, PowerPoint
- Planfree
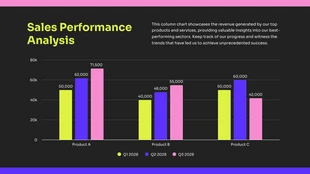
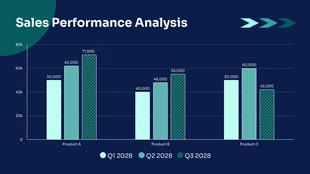
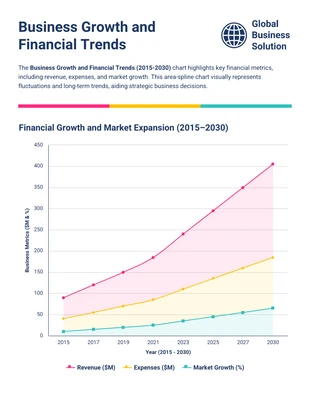
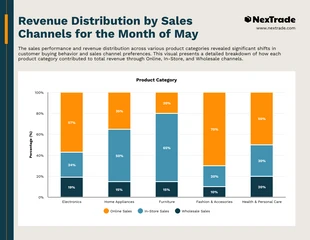
Unleash your creativity with our Dark Blue Sales Performance Analysis Histogram Chart Template. Perfectly designed to illustrate and communicate key sales metrics effectively, this template offers an engaging layout with customizable options. Its dark blue theme not only gives a professional look but also draws attention to important data. The histogram chart allows for clear visualization of your sales performance. What's more exciting is that this template is versatile - you can add colors, tweak sizes, and select the best photos or icons to suit your brand's style. With a vast array of options in our free stock libraries, you can create a design on Venngage that truly resonates with your audience. Use this ideal design to promote your insights and wow everyone with your analytical prowess!
Related charts
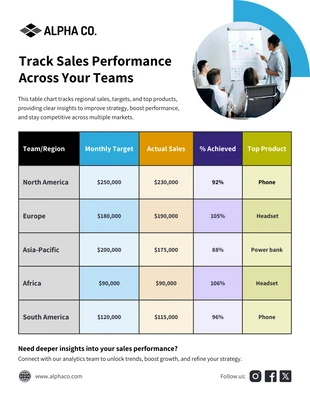
table charts
column charts
column charts
column charts
stacked charts
pareto charts
histogram charts
stacked charts
area charts
histogram charts
column charts