
Most Hated Fruit Pie Chart Example
Looking for an example of pie chart? Look no further at Venngage we provide a customizable template for you to edit in just a minute.

 100% customizable templates
 Millions of photos, icons, charts and graphics
 AI-powered editing features
 Effortlessly share, download, embed and publish
 Easily generate QR codes for your designs
- SizeLetter (11 x 8.5 in)
- File typePNG, PDF, PowerPoint
- Planbusiness
Example of pie chart is a graphical representation of numerical data divided into sectors, or slices, to show percentages. The shape of the sectors is round like a circle or pie. The percentage of each sector represents how much of the whole item each category represents. Example of pie chart is used to compare multiple categories at the same time to show which one is larger or smaller. Example of pie chart helps users understand the breakdown of resources in different categories and how those resources are being used by organizations. Users can also see how different organizations compare in terms of resources used, which allows them to make decisions about who they will work with or purchase from next time they need something similar. Most people are unfamiliar when doing design. Venngage developed this example of pie chart that is easy for beginners to use even if they have never designed anything before. This template is designed to help you create pie chart that are easy to understand and visually appealing. Each element has been carefully chosen
Related Chart Templates
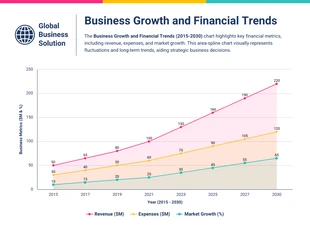
table charts

column charts
tree map charts
table charts
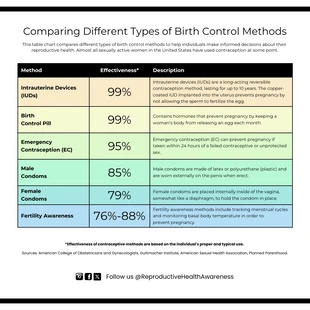
table charts
table charts
table charts
area charts

funnel charts