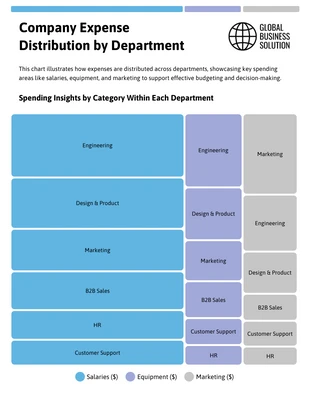
Financial Statement Bar Chart Template
Showcase data, understand trends, and communicate information more effectively than plain text or numbers using this chart template.

 100% customizable templates
 Millions of photos, icons, charts and graphics
 AI-powered editing features
 Effortlessly share, download, embed and publish
 Easily generate QR codes for your designs
- Design stylemodern
- Colorslight
- SizeLetter (8.5 x 11 in)
- File typePNG, PDF, PowerPoint
- Planfree
A chart is a pictorial representation of data, typically in the form of a graph or table. Charts are often used to make data easier to understand by displaying it in a visually appealing way. There are many different charts, each designed for a specific purpose. Charts can be a valuable tool for presenting data and understanding trends. They can also be used to communicate information more effectively than text or numbers alone. When used well, charts can make it easier to see patterns and relationships in data. They can also help highlight significant trends and outliers. However, it is essential to note that you should not use charts blindly. They should only be used when they genuinely add value to the presented data. In some cases, a simple table of numbers may be more effective than a chart. When choosing a chart type, selecting one that is appropriate for the presented data and the message you want to communicate is crucial. When creating a chart, remember a few basic things: Make sure the data is accurate and up-to-date. Choose a chart type
Related Chart Templates
table charts
tree map charts
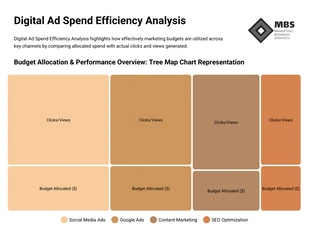
tree map charts
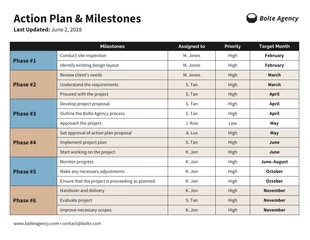
table charts
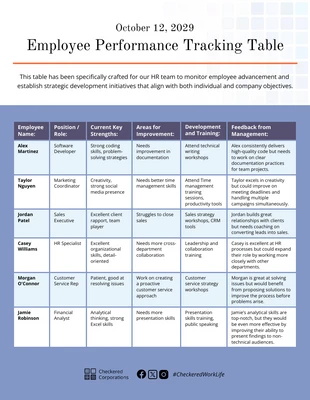
table charts
tree map charts
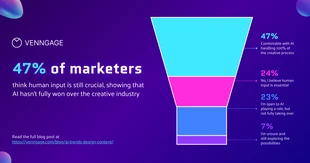
funnel charts
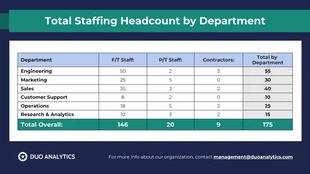
table charts
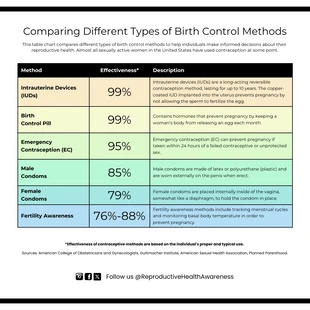
table charts