
Visualizing Data in LMS Infographic Template
Searching for the perfect visualizing data in learning management systems infographic?

 100% customizable templates
 Millions of photos, icons, charts and graphics
 AI-powered editing features
 Effortlessly share, download, embed and publish
 Easily generate QR codes for your designs
- Design stylemodern
- Colorslight
- SizeCustom (816 x 4450 px)
- File typePNG, PDF, PowerPoint
- Planpremium
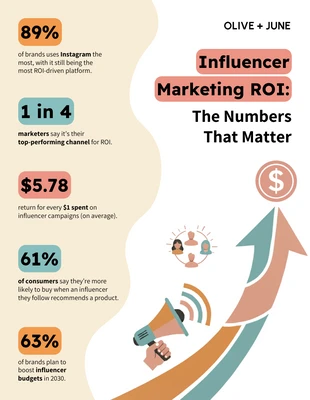
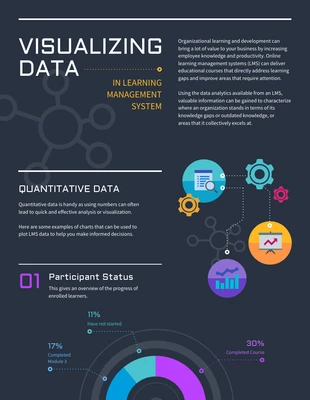
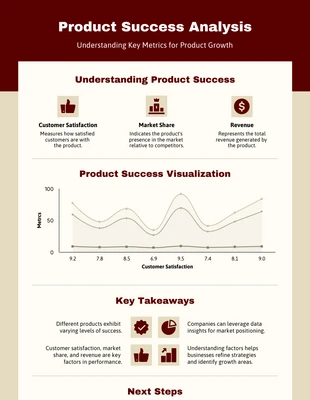
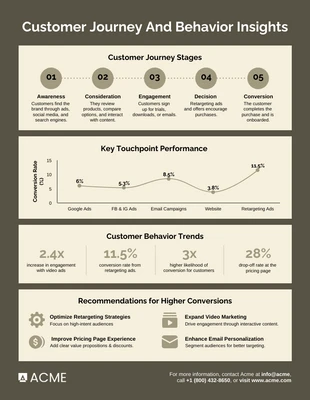
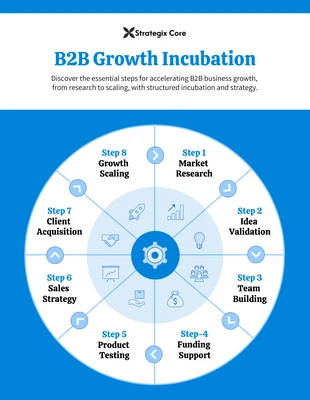
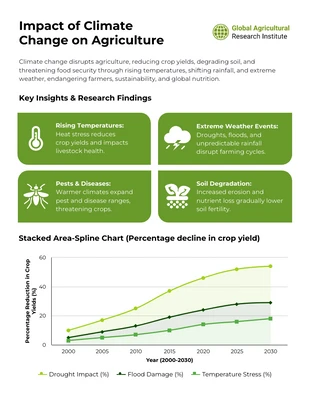
One of the most important tools in learning management system is visualizing data. While we depend on numbers and statistics to recognize patterns and trends, it's difficult for us to visualize that information without a helpful lifeline. Therefore an infographic is a great way to get across or teach our audience about something quickly and easily, especially when you're trying to explain complex information. This infographic offers a quick view of what you can do to create great visualizations in learning management systems, as well as where those visualizations lead. Are they helping students learn? Are they getting faculty involved? Or are the results just a jumbled mess that's better off being ignored? This is a quick and easy way to help you determine what's working and how you can improve. Venngage editor is simple and easy to use. You can customize everything you see from there, from font styles, icon styles, color palette and the content itself. Our visualizing data in learning management systems infographic template is editable and you can freely add in information! It's a way to save more
Related Infographic Templates
statistical infographics

health infographics
health infographics
statistical infographics
process infographics

circle infographics
product infographics
marketing infographics

statistical infographics
circle infographics
research infographics
circle infographics