
Scale Infographic Template
Use our scale infographic template at Venngage to create a stunning scale infographic that will have your readers oohing and ahhing in no time.

 100% customizable templates
 Millions of photos, icons, charts and graphics
 AI-powered editing features
 Effortlessly share, download, embed and publish
 Easily generate QR codes for your designs
- Design stylefun, modern
- Colorsvibrant, light
- SizeLetter (8.5 x 11 in)
- File typePNG, PDF, PowerPoint
- Planfree
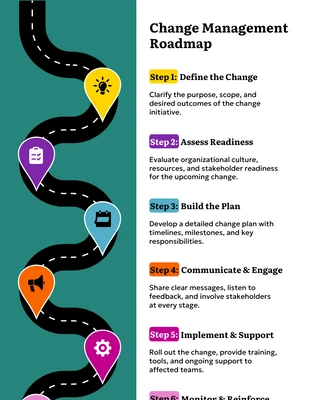
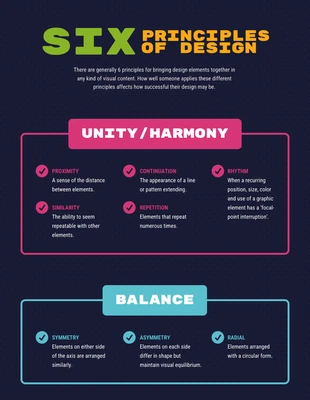
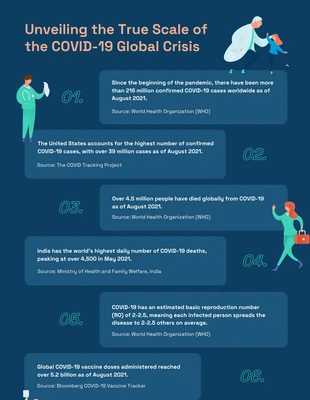
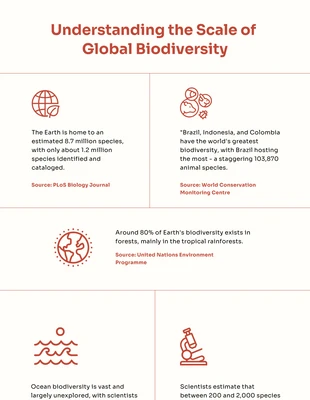
Scale infographics are an incredible way to visualize data, and they can help you and your readers understand your data better than ever before. A scale infographic is a visual way to display information in an understandable format. It allows you to show how your data compares with other data or with the average or median. You can also use a scale infographic to compare different categories of data, such as comparing one brand's social media engagement and another brand's customer satisfaction rates. Scale infographics are a great way for users to quickly scan through lots of information and get an idea of what the data looks like at a glance. They allow users who aren't interested in reading every single word on your page to still glean information from it, which ultimately makes them more likely to read the rest of your content. Using a scale infographic allows you to show off how much better your company's performance is than others in its industry or sector without having to write out long paragraphs explaining why this is so important! It also allows
Related Infographic Templates
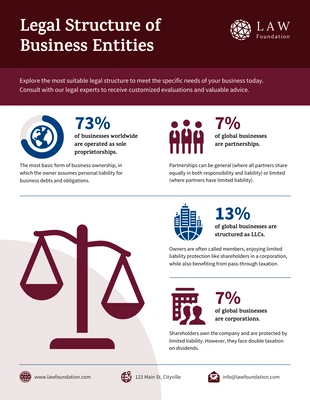
law infographics
timeline infographics
timeline infographics

informational infographics
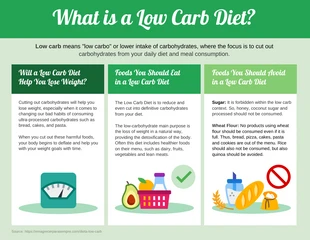
nutrition infographics
process infographics
informational infographics

list infographics

product infographics

mental health infographics
covid infographics
science infographics