Sales Infographic Template
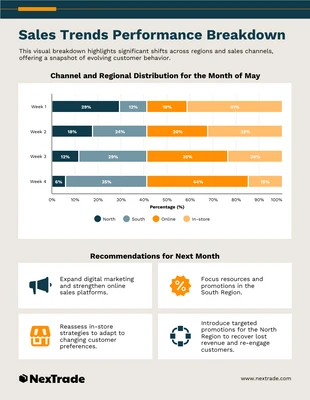
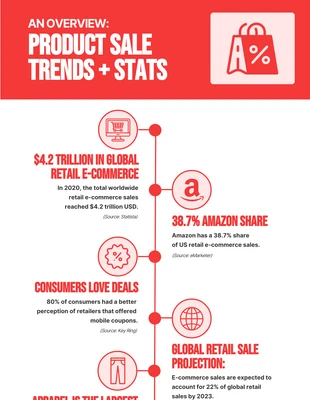
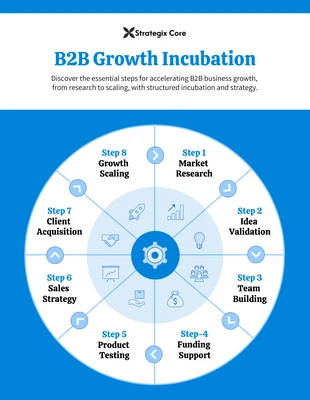
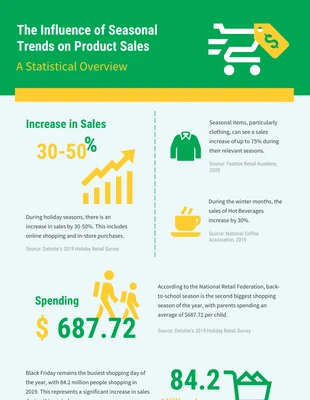
Sales infographics are great tools for organizing all of your sales-related facts and statistics, assisting staff in their sales efforts, and keeping them up to date on industry trends.
100% customizable templates
Millions of photos, icons, charts and graphics
AI-powered editing features
Effortlessly share, download, embed and publish
Easily generate QR codes for your designs
- Design stylemodern
- Colorsvibrant
- SizeCustom (816 x 2200 px)
- File typePNG, PDF, PowerPoint
- Planpremium
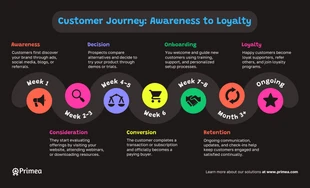
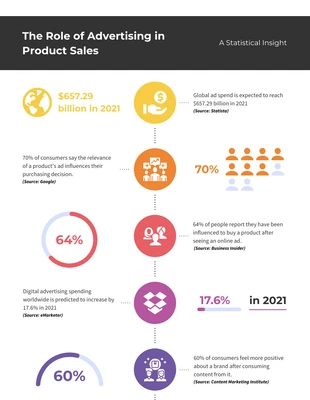
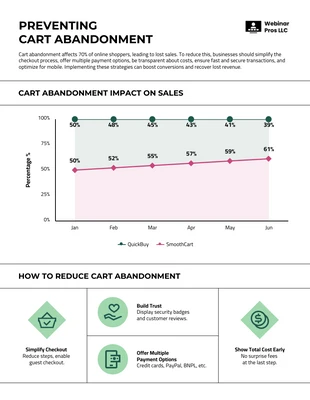
Being in the sales business, you’re faced with a variety of challenges, such as conducting your selling processes, presenting data to potential clients, and building customer relationships. Fortunately, our sales infographic helps you visualize your data, which results in an improved understanding of your business and how it stacks up against others in your field. A sales infographic is a great way to communicate the details of your business in a visual, fun, and engaging way. Our sales infographic has visual representations of everything you need to present! Rich data and charts, helpful tips, and information. A great tool for organizing all of your sales-related facts and statistics, assisting staff in their sales efforts and keeping them up to date on industry trends. It has visual representations of everything you need to keep track of, whether it be leads generated, opportunities created, or campaigns started. Keep your team up to date with this useful tool! Sales infographics are a great way to visually communicate your sales information and statistics. They can help staff in their focus and presentation, as well as keep them

