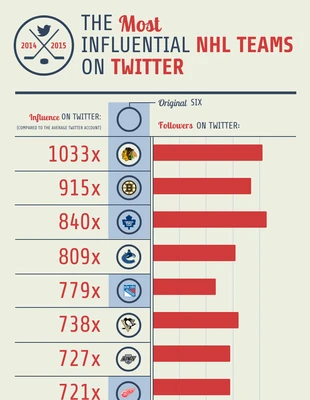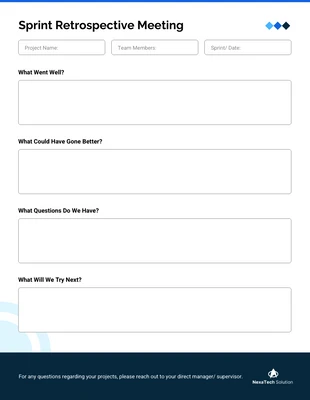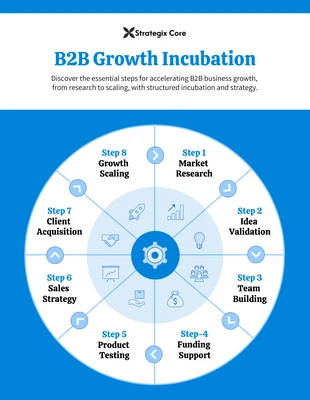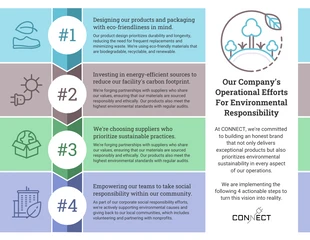
NHL Teams Sports Infographic Template
Easily edit this sports infographic template to capture fun sports statistics, share cool insights, and create a compelling infographic design.
100% customizable templates
Millions of photos, icons, charts and graphics
AI-powered editing features
Effortlessly share, download, embed and publish
Easily generate QR codes for your designs
- Design stylemodern, retro
- Colorslight
- SizeCustom (816 x 2500 px)
- File typePNG, PDF, PowerPoint
- Planpremium
A professionally-designed sports infographic allows you to present complex sports data in a way that’s engaging and exciting. Whether you want to present team statistics, trends for the season, player insights, or even financial data, an engaging sports infographic makes you look like an expert. Using this sports infographic template, you can create your own sports infographic without any design experience at all. Get started with this sports infographic template that you can customize in a few minutes using Venngage’s editor. Click on the create button to kick off your sports infographic design. You can customize the entire template with ease. In the Venngage editor, update the charts, apply a new color palette and use professional icons to create something a graphic designer would. Effortlessly visualize your data. You can add your own unique data to a variety of charts to transform this sports infographic template instantly. Choose anything from tables, to graphs, to pie charts, and everything in between. Venngage has you covered with an extensive collection of charts that you can use to present sports data effectively. Venngage Tip:


