
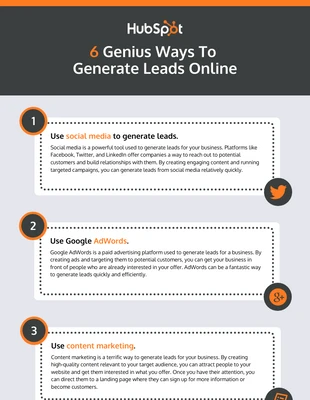
Hubspot Infographic Template
Restrategize your marketing or educational campaigns and increase conversion rates by customizing this Hubspot infographic.

 100% customizable templates
 Millions of photos, icons, charts and graphics
 AI-powered editing features
 Effortlessly share, download, embed and publish
 Easily generate QR codes for your designs
- SizeCustom (816 x 2000 px)
- File typePNG, PDF, PowerPoint
- Planfree
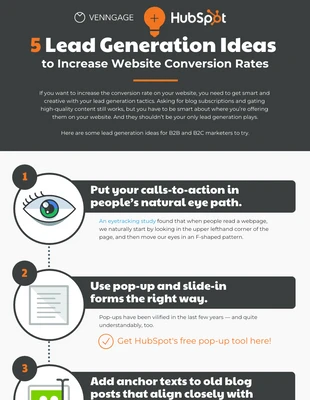
An infographic is a visual representation of data, typically in the form of a graph or chart. Often used to make complex ideas more understandable and easy to digest, they are prevalent in news and journalism. You can use them in many ways, such as in marketing, education, or entertainment. In recent years, the popularity of infographics has exploded, thanks in part to the rise of social media and the increasing use of data visualization in mainstream media. When creating an infographic, ensure that the information you are trying to communicate is clear and easy to understand. Choose a visual representation that is both visually appealing and effective in conveying the information. Make sure that your infographic is shareable and can be easily shared on social media. With these tips, you can create an informative and visually appealing infographic. You can include many different elements in an infographic. The essential ingredients are a header, subheadings, body text, and visualizations. The header is the main title of the infographic and should be concise and to the
Related Infographic Templates
timeline infographics
informational infographics
environment infographics

process infographics
mental health infographics
tree infographics
informational infographics
process infographics
cinco de mayo infographics
informational infographics
process infographics
environment infographics