
Haunted House Statistics Infographic Template
Want to share important haunted house statistics to your audience? Start by editing and customizing this infographic template from Venngage today.

 100% customizable templates
 Millions of photos, icons, charts and graphics
 AI-powered editing features
 Effortlessly share, download, embed and publish
 Easily generate QR codes for your designs
- Design stylefun, modern
- Colorsvibrant
- SizeLetter (8.5 x 11 in)
- File typePNG, PDF, PowerPoint
- Planfree
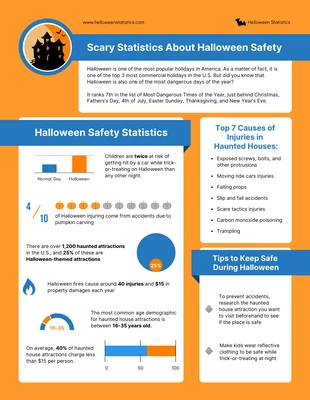
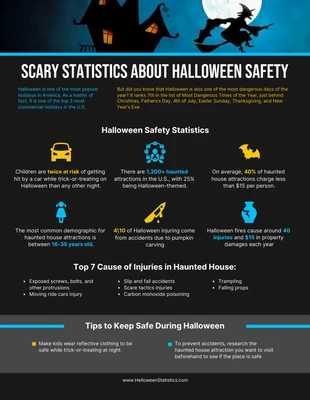
One of the most awaited holidays in the U.S. is Halloween. This is the season when kids get to roam the neighborhood streets while trick-or-treating and adults enjoy wearing their character costumes on the way to the hippest Halloween parties. As one of the most commercialized holidays in the U.S., Halloween is considered a billion-dollar industry. Americans spend an average of $25 to $45 each year to purchase stuff and celebrate Halloween. As more people start to spend money on Halloween costumes, candies, and treats, an industry that gets a fair share of consumer spending is the haunted house industry. The growth and popularity of haunted house attractions have skyrocketed in recent years. This infographic about haunted house statistics aims to share fun and interesting facts about Halloween and haunted house attractions. During the Halloween season, attendance in haunted houses spikes up significantly. There are over 1,200 unique haunted attractions in the U.S., and around 300 of these are Halloween-themed. While kids roam the neighborhood doing trick-or-treats, adults often look for scarier, more exciting ways to celebrate Halloween. Haunted house attractions give
Related Infographic Templates
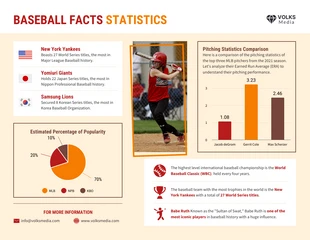
baseball infographics
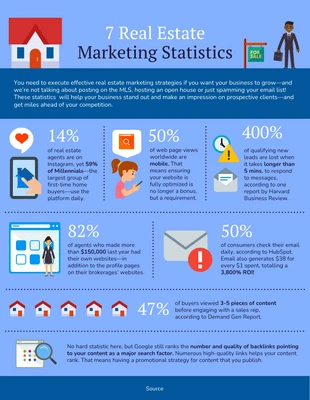
real estate infographics
fun data infographics
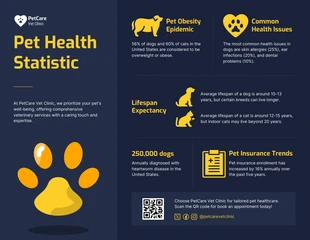
pet infographics

cartoon infographics
fun data infographics
horror infographics
house infographics
fashion infographics
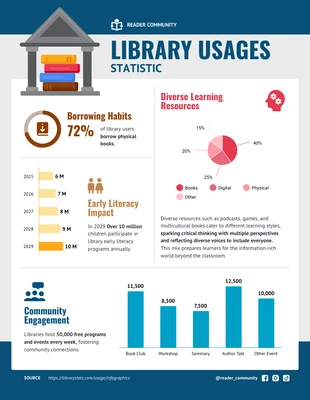
library infographics
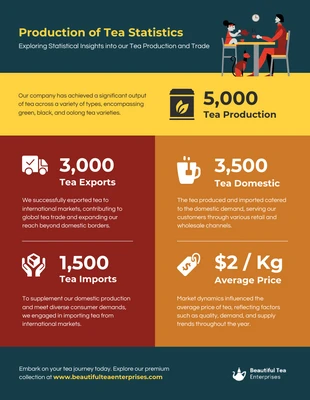
tea infographics
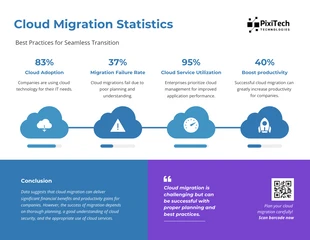
cloud infographics