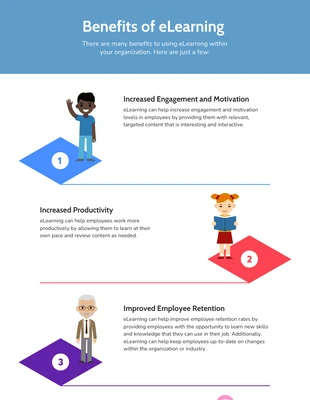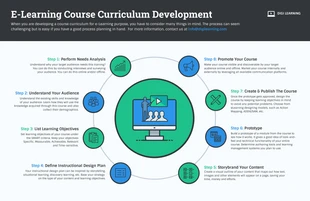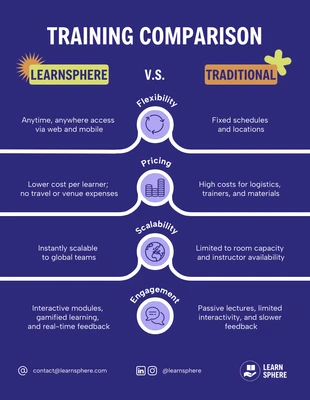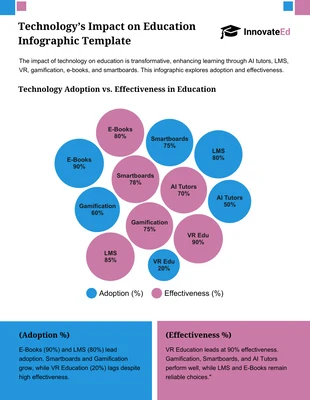
Benefits of Elearning Infographic Template
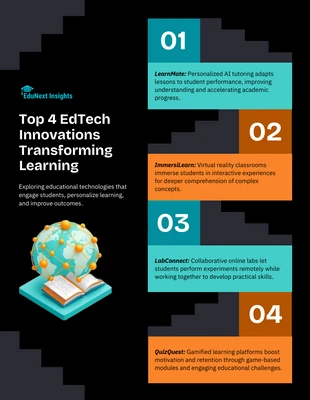
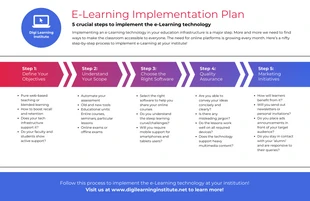
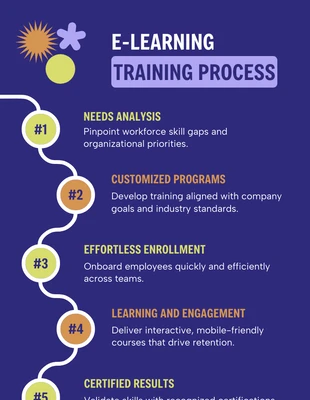
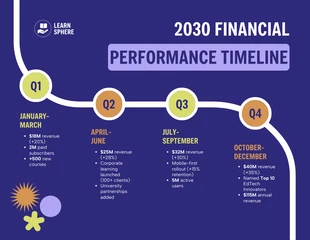
Give learners an overview of a topic or concept by using an ELearning Infographic for your lessons.
100% customizable templates
Millions of photos, icons, charts and graphics
AI-powered editing features
Effortlessly share, download, embed and publish
Easily generate QR codes for your designs
- Design stylemodern
- Colorsvibrant, light
- SizeCustom (816 x 3200 px)
- File typePNG, PDF, PowerPoint
- Planfree
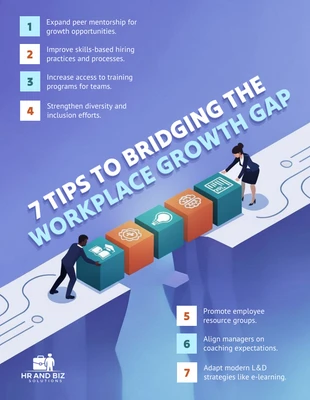
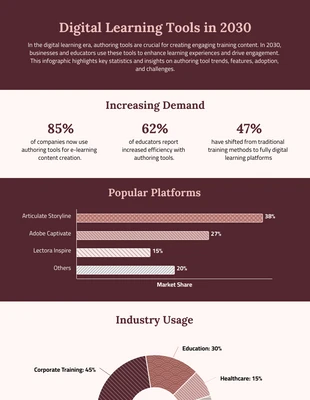
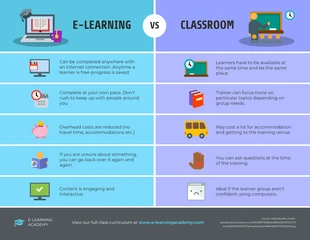
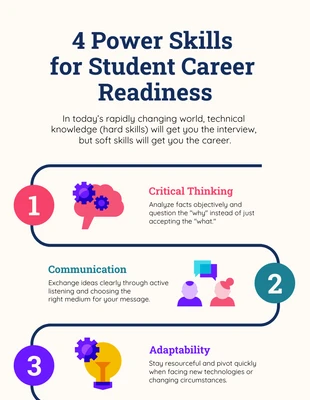
An Elearning Infographic can be used to communicate a wide range of information, from the course content and learning objectives to assessment results and statistics. They can also be used to give learners an overview of a particular topic or concept or to provide step-by-step instructions on how to complete a task. When used effectively, Elearning Infographic can be a powerful tool for enhancing the learning experience and promoting the retention of information. They can also help to break up longer pieces of text and make complex topics more accessible. Elearning infographics are visual representations of data or information that are designed to be both informative and visually appealing. They can be used to present a variety of topics, including educational concepts, research findings, or statistical data. Typically, it is in the form of a graph or chart, that is designed to communicate complex information quickly and effectively. They can be used in a variety of settings, including online courses, presentations, and websites. When used effectively, they can help learners understand complex information quickly and easily. Additionally, they can add

