
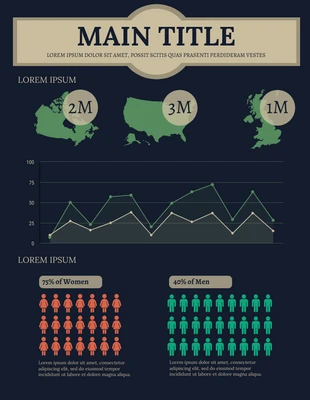
Blank Statistical Infographic Template
Turn stats into a visual report by modifying this Data Statistical Infographic Template

 100% customizable templates
 Millions of photos, icons, charts and graphics
 AI-powered editing features
 Effortlessly share, download, embed and publish
 Easily generate QR codes for your designs
- Design styleretro
- Colorsdark
- SizeLetter (8.5 x 11 in)
- File typePNG, PDF, PowerPoint
- Planpremium
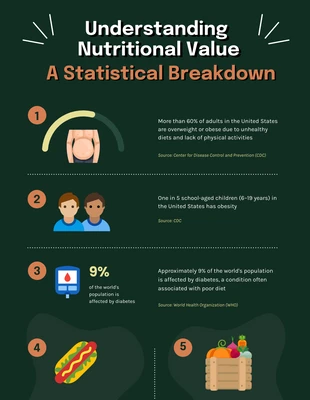
Create a professional data infographic and more with this customizable Data Statistical Infographic Template. The infographic features charts, icons, and a modern color scheme that you can modify within minutes for a classy design. Start out by inserting charts into the Data Statistical Infographic Template that helps communicate the data clearly. Venngage has all sorts of charts and tables you can use, including, but not limited to bar charts, line charts, maps, and pie charts. Consider adding icons to the statistical infographic to keep your reader's attention and the data more readable. There's a gallery full of high-quality stock icons available on Venngage and you can adjust their size and select their color for a more prominent design. Complete your data infographic by choosing a modern color scheme that not only grabs attention, but also adds a professional look. You can either make your own modern color scheme, or you can apply one of Venngage's pre-generated color palettes to the statistical infographic. Get started personalizing your own data infographic today!
Related Infographic Templates
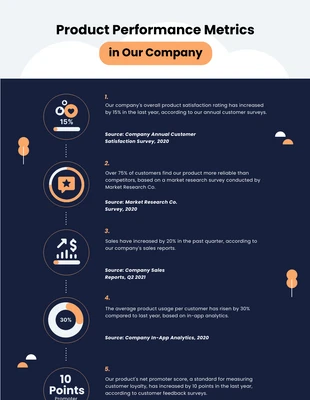
company infographics
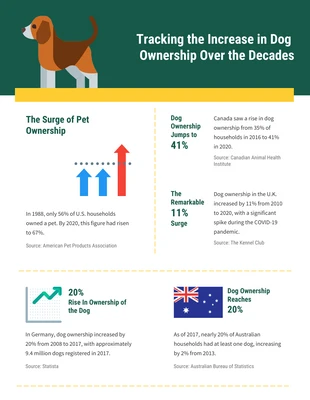
dogs infographics
 1/2
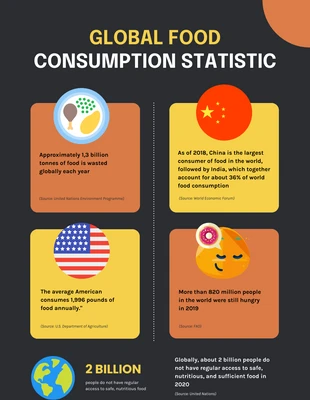
1/2food infographics
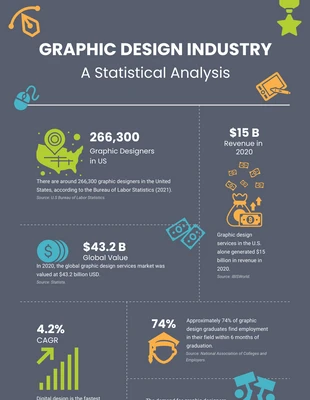
graphic design infographics
food infographics

finance infographics
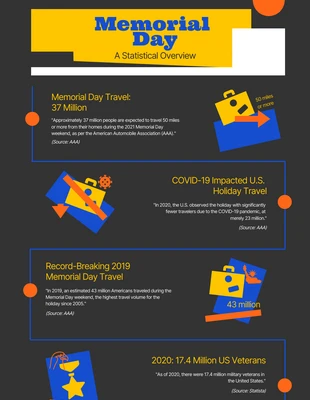
memorial day infographics
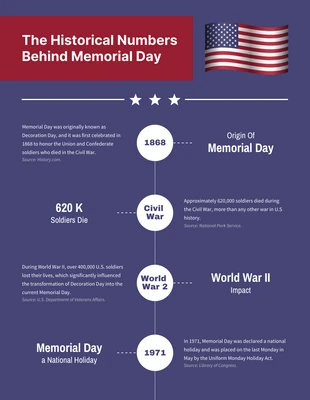
memorial day infographics
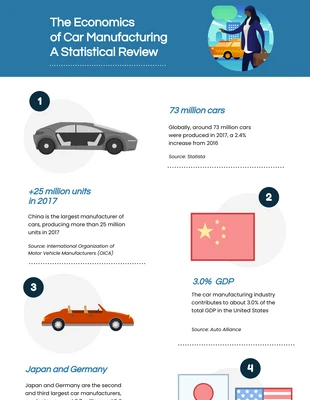
car infographics
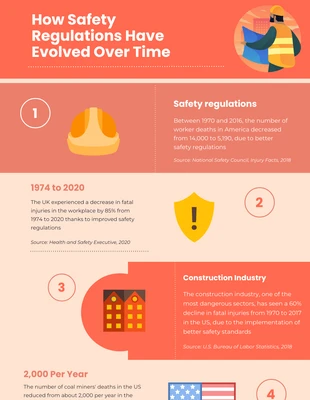
safety infographics
statistical infographics
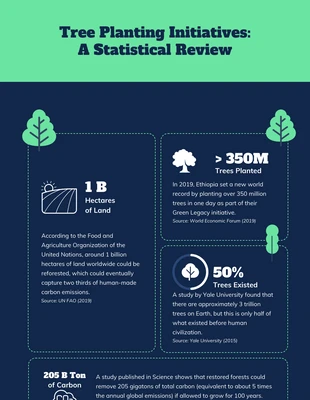
tree infographics