
Clock Style Recruitment Process Infographic Template
Help make your data more visually attractive and communicate your message more efficiently using a clock infographic.

 100% customizable templates
 Millions of photos, icons, charts and graphics
 AI-powered editing features
 Effortlessly share, download, embed and publish
 Easily generate QR codes for your designs
- Design stylemodern, fun
- Colorslight
- SizeCustom (816 x 1200 px)
- File typePNG, PDF, PowerPoint
- Planbusiness
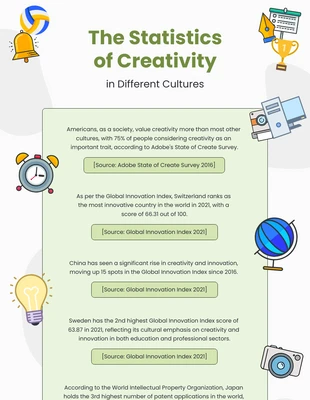
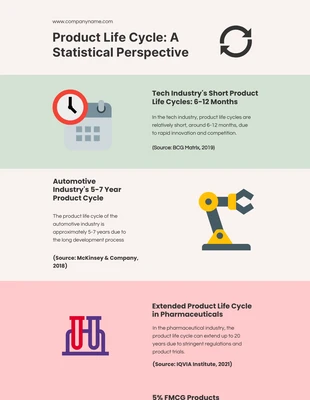
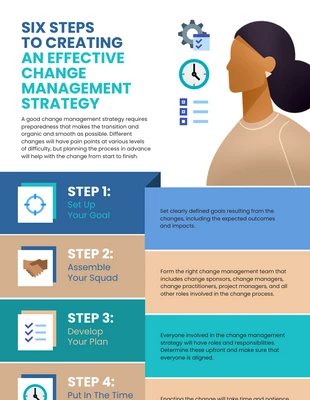
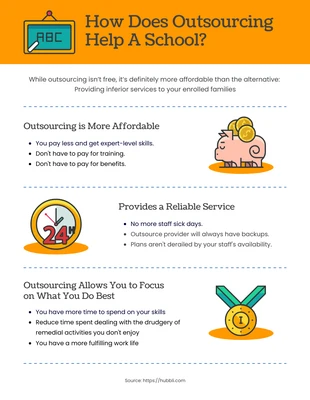
A clock infographic is a simple yet effective way to represent data or information in a graphical format. It uses a variety of visual elements to convey information in an easily digestible manner, making it perfect for both presentations and reports. It is often used to track a project's progress or display data over time. An essential element of a clock infographic is the clock face with hour and minute markings around the perimeter representing the progress of time. They typically start at the top of the clock face and move clockwise around the circumference. The size and color of the hands can vary depending on the purpose of the clock infographic template. Users may use larger hands to indicate a more extended period with smaller hands to indicate a shorter time. Numbers and arrows are other critical elements of a clock infographic. They are generally used to mark a series of steps or track a project's progress and can be displayed in various ways. Arrows, on the other hand, are used to point the direction of the hands of a clock
Related Infographic Templates

marketing infographics
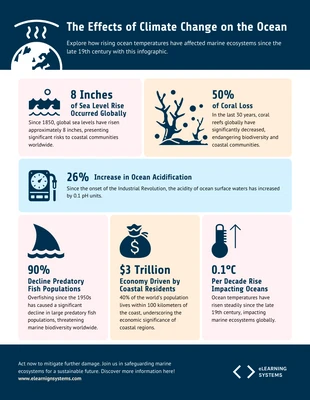
ocean infographics
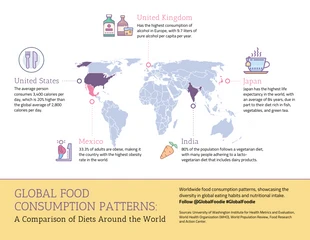
geographic infographics
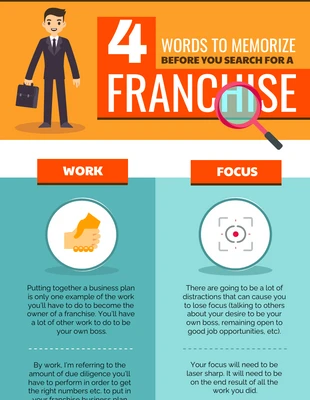
informational infographics

human resources infographics
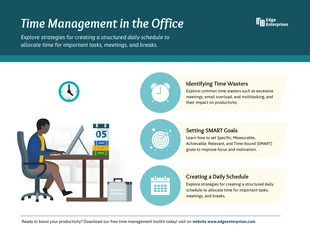
office infographics

real estate infographics
creative infographics
product infographics
process infographics
informational infographics
vintage infographics