
Constructing A Modern Home Design Infographic Template
Build a case for an argument, show off business data, or present facts and trends by editing this basic infographic template .

 100% customizable templates
 Millions of photos, icons, charts and graphics
 AI-powered editing features
 Effortlessly share, download, embed and publish
 Easily generate QR codes for your designs
- Design stylefeminine, modern
- Colorslight, vibrant
- SizeCustom (816 x 1500 px)
- File typePNG, PDF, PowerPoint
- Planfree
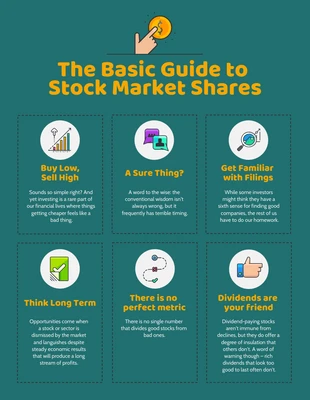
A basic infographic contains three key elements: data, visuals, and text. Data is represented in the form of numbers and statistics, visuals are used for illustrations and graphs, and text is used to provide context and explanation. By combining these three elements, an infographic is able to communicate complex information in a simple and easy-to-understand format. Basic infographics can be used on websites, presentations, email newsletters, and printed materials. An infographic can be helpful anywhere you need to distill complex information down to a simple and easy-to-understand format. When used correctly, infographics can be an incredibly powerful marketing tool. They can help you convey your message more effectively and reach a wider audience. One of the most important aspects of an infographic is its ability to tell a story. A well-designed infographic should be able to take the viewer on a journey, from start to finish, in a way that is both engaging and informative. To do this, infographics must be carefully crafted, with each element working together to create a cohesive whole. When creating an infographic, there are a few things to
Related Infographic Templates
informational infographics
science infographics
list infographics
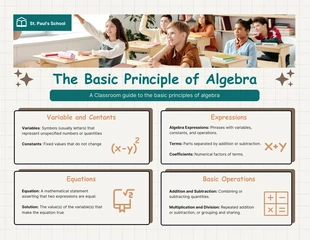
math infographics
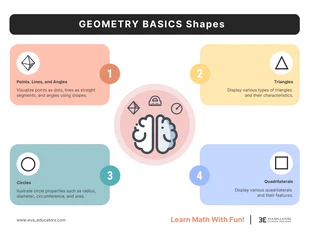
math infographics
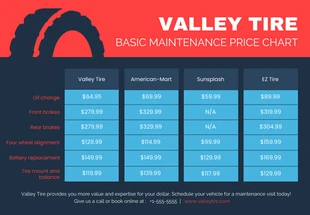
comparison infographics
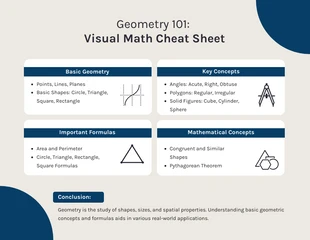
math infographics
math infographics
list infographics
office infographics
business infographics
process infographics