How To Make The Most Of Your Twitter Analytics Infographic
Category
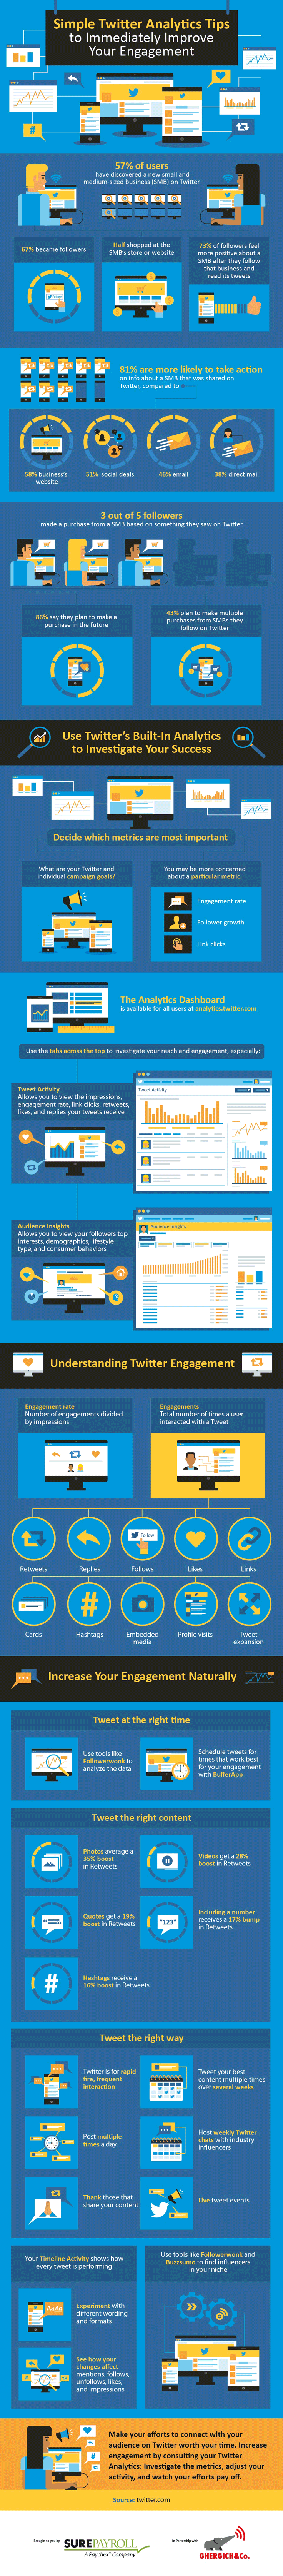
Business Infographic Examples, Infographic Examples, Marketing Infographic Examples, Social Media Infographic ExamplesAnalytics of social media doesn’t have to be boring! With the right social media infographics, you can make analytics fun and interesting to read. For instance, take this marketing infographic example from Sure Payroll.
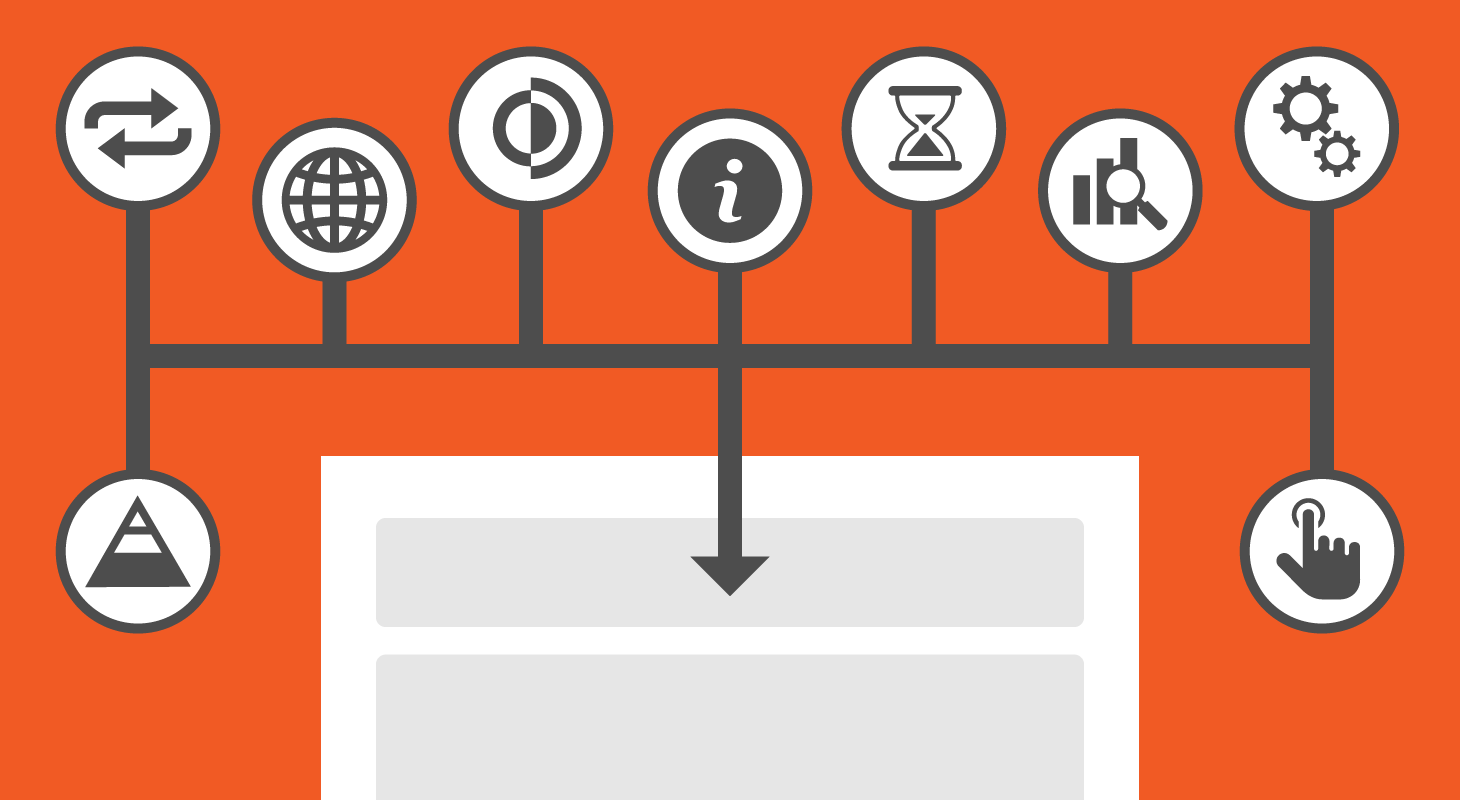
It immediately draws you in with bright colors, images, and icons! The Twitter infographic takes analytics to a whole new level just by making it visually appealing.
With a bright color palette, it’s sure to grab people’s attention. Try out several colors to see what works for your social media infographics or stick to one that matches your branding!
This marketing infographic also uses a modern font with bold titles and large headings to make the text stand out. It’s further emphasized with text boxes so the content doesn’t get lost in the background.
Display data with circle graphs and columns so its easier to read and will keep readers focused.
The addition of images and icons to this social media infographic help break up large amounts of information as make it appealing to read. Get your social media infographics noticed with these design methods!
Infographic Features
- Illustrated Icons
- Large Headings
- Bold Titles
- Modern Font
- Text Boxes
- Bright Color Palette
- Graphs & Charts
- Columns
- Social Media Infographic Examples
- Marketing Infographic Examples
- Business Infographic Examples
Source
Color Palette
#2E66A2
#3266A2
#FFCC33
–
Size
736 × 6696px
–
Creator:
Learn More About Infographic Design

Coming up with a great design idea from scratch is hard work! That’s why we have collected over 1000 examples of infographics, flyers, brochures, posters and more, to inspire designers of all skill levels.