
USA Gasoline Prices Infographic Template
Rising gas prices in the USA are a major concern to motorists, and this trend has been captured visually in this professional infographic design.

 100% customizable templates
 Millions of photos, icons, charts and graphics
 AI-powered editing features
 Effortlessly share, download, embed and publish
 Easily generate QR codes for your designs
- Design stylemodern
- Colorsvibrant
- SizeCustom (816 x 4200 px)
- File typePNG, PDF, PowerPoint
- Planpremium
Rising gas prices in early 2021 in the US have alarmed many motorists who drive on a regular basis. According to the U.S. Energy Information Administration, the national average price for regular retail gasoline surpassed and remained above the $3 mark since mid-May. The last time the national average was that high was all the way back in October 2014, when a nearly four-year long run of prices above $3 per gallon gas came to its end. This Rising Gas Prices infographic doesn’t only look at the trend in rising gas prices, it investigates why. Through the use of visual storytelling and data visualization, this infographic is a great FAQ resource on a complex topic. It’s also a completely customizable infographic template perfect for non-designers to create their own viral, data-driven infographics. Here’s how you can take meaningful data and visualize it effectively. This Rising Gas Prices infographic is a great template to get you started. With a unified color palette, simple icons and clever chart designs, you can quickly create your own data-driven infographic. Click create and you’ll be
Related Infographic Templates
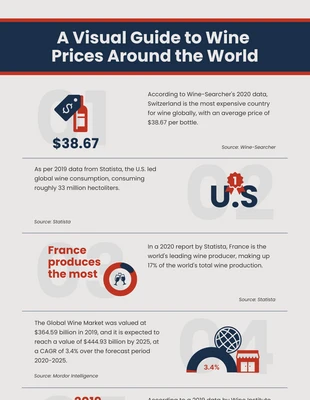
wine infographics
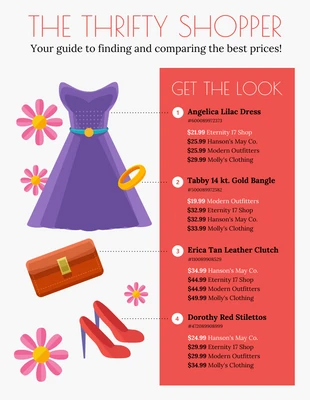
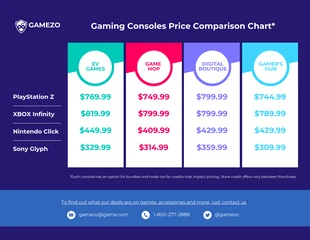
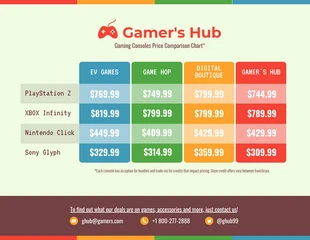
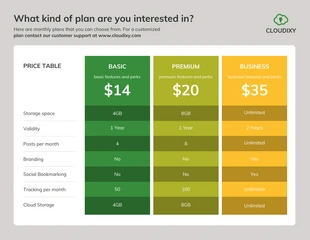
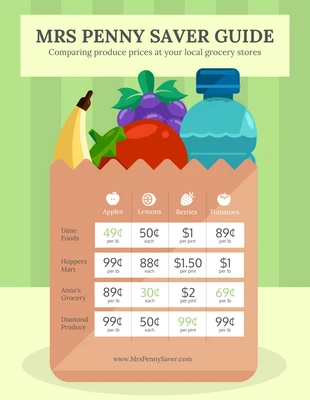
comparison infographics
comparison infographics
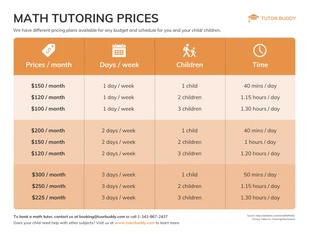
statistical infographics
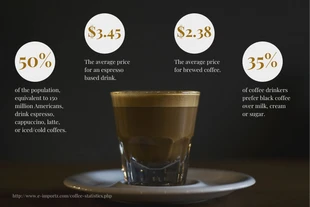
comparison infographics
comparison infographics
comparison infographics
comparison infographics
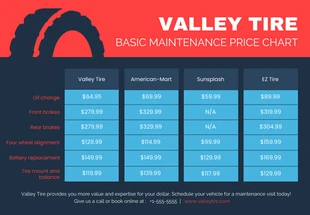
comparison infographics

informational infographics
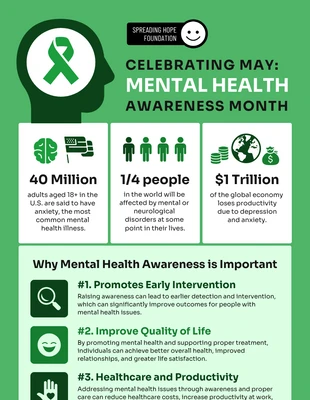
mental health infographics
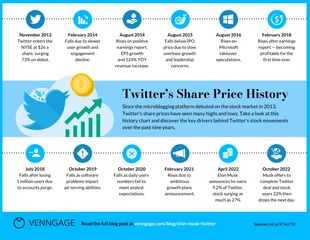
timeline infographics