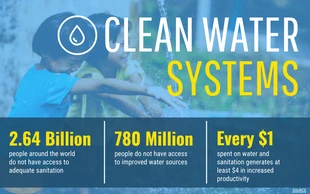
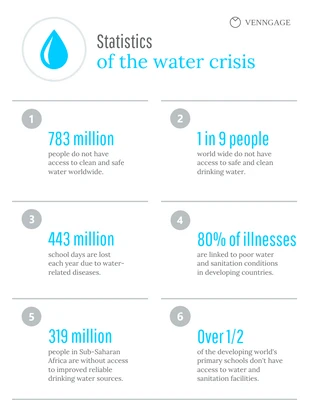
Water Crisis Statistics Infographic Template
Does your audience know about the water crisis? Inform them by modifying this Water Statistics Infographic Template

 100% customizable templates
 Millions of photos, icons, charts and graphics
 AI-powered editing features
 Effortlessly share, download, embed and publish
 Easily generate QR codes for your designs
- Design stylemodern
- Colorslight
- SizeCustom (816 x 1600 px)
- File typePNG, PDF, PowerPoint
- Planfree
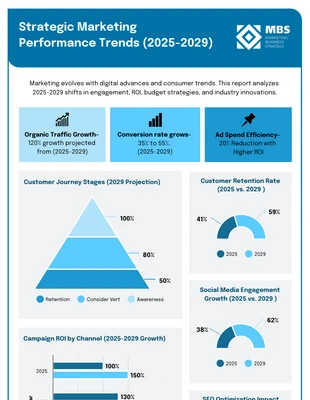
Make a subtle statistical infographic and more with this Water Statistics Infographic Template. Customize the infographic with a minimal color scheme, icons, and shapes for a clean-cut design. Keep the Water Statistics Infographic Template simple by using a minimal color scheme that won't distract from the content. There's several pre-generated minimal color schemes on Venngage, but you also have the option to create your own color palette the way you want. Next, insert a few icons to show readers what the topic is and to make the infographic more eye-catching. You'll find an array of icons available on Venngage and you can search for the icons you want by keyword. Additionally, you can enhance the icons by incorporating shapes as frames. Venngage has a plethora of shapes in numerous styles, so pick the shapes that work for your statistical infographic! Not precisely the infographic you were searching for? Look through the Venngage library for more editable statistical infographic templates!
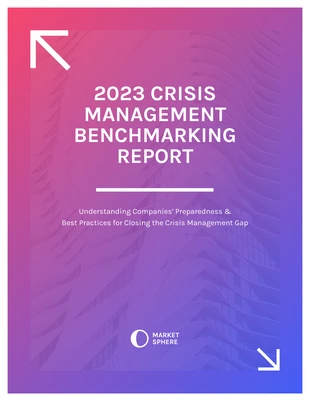
Related Report Templates
 1/5
1/5marketing reports
consulting reports
human resources reports
 1/5
1/5marketing reports
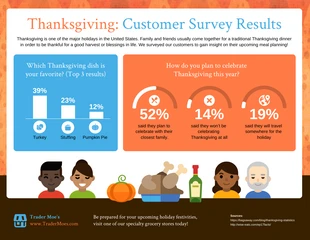
survey results reports
 1/5
1/5executive summary reports
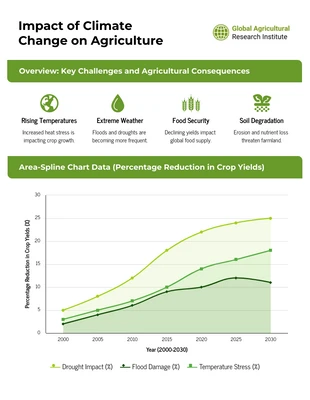
research reports
marketing reports
annual reports
 1/5
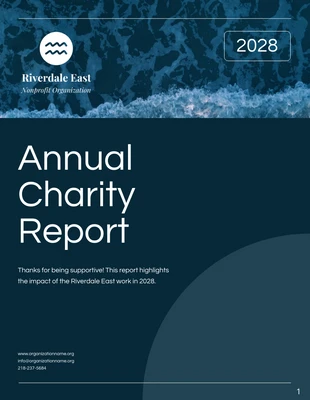
1/5charity reports