
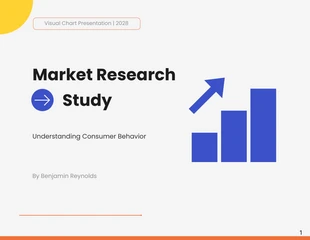
Chart in Powerpoint Presentation Template
Make sense of large quantities of data and discover relationships between data sets using this easy-to-edit chart in PowerPoint template.

 100% customizable templates
 Millions of photos, icons, charts and graphics
 AI-powered editing features
 Effortlessly share, download, embed and publish
 Easily generate QR codes for your designs
- Design stylevintage
- Colorslight
- SizeCustom (1024 x 576 px)
- File typePNG, PDF, PowerPoint
- Planfree
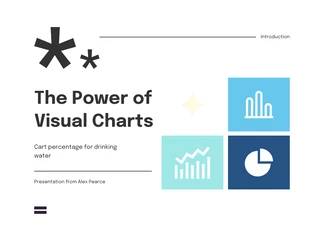
A chart is a graphical representation of data defined by symbols, such as bars in a bar chart, lines in a line chart, or slices in a pie chart. It can represent tabular numeric data, functions, or qualitative structure and provides different information. Charts are often used to make it easier to understand large quantities of data and the relationships between other parts of the data. There are many kinds of charts: line charts, bar charts, pie charts, scatter plots, and more. PowerPoint provides a variety of built-in chart templates that you can use to create your graphs. You can also insert charts from other Microsoft Office programs, such as Excel. When you create a chart in PowerPoint, you can choose to display it as an object in a slide or embed it in another object, such as a table or shapes. You can also add interactivity to your charts so your audience can explore the data more deeply. For example, you can add hyperlinks to your charts that open other slides or websites when clicked. Charts can be valuable to your PowerPoint
Related Presentation Templates
 1/5
1/5visual chart presentations
 1/6
1/6visual chart presentations
 1/5
1/5visual chart presentations
 1/5
1/5human resources presentations
 1/5
1/5marketing presentations
 1/5
1/5education presentations
 1/5
1/5business presentations
 1/5
1/5research presentations
 1/5
1/5visual chart presentations
 1/5
1/5visual chart presentations
 1/5
1/5health presentations
 1/18
1/18finances presentations