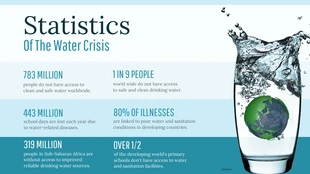
Water Pollution Infographic Template
Help keep the earth clean and educate readers by customizing this Water Pollution Infographic Template
100% customizable templates
Millions of photos, icons, charts and graphics
AI-powered editing features
Effortlessly share, download, embed and publish
Easily generate QR codes for your designs
- Design stylemodern
- Colorsvibrant
- SizeCustom (816 x 2500 px)
- File typePNG, PDF, PowerPoint
- Planfree
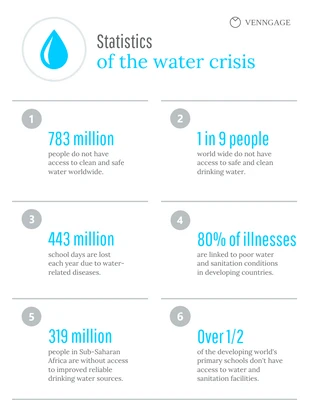
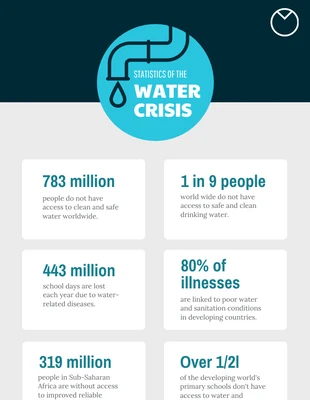
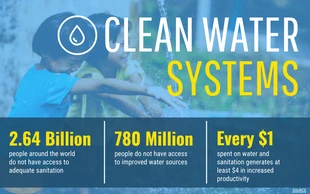
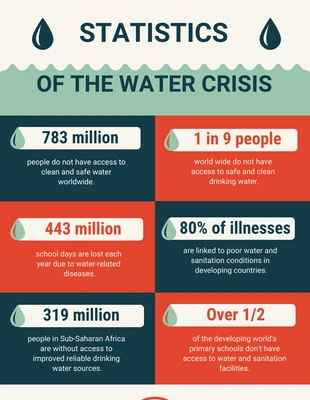
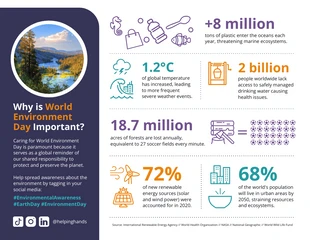
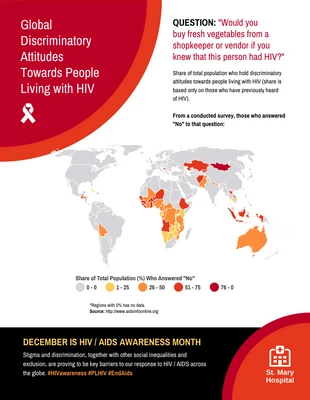
Put together a basic data infographic and more with this customizable Water Pollution Infographic Template. It features icons, bold headings, and a minimal color scheme that you can alter in no time for the perfect infographic. Break up large chunks of text and data by utilizing icons for the Water Pollution Infographic Template. Venngage has thousands of impressive icons that you can take advantage of to enhance your statistical infographic. Once you've replaced the content with your own, apply bold headings so each section is clear and concise. Not only can you use bold typeface to transform the text, but you can also add italics and resize the text if necessary. Put the finishing touches on the Water Pollution Infographic Template by choosing a minimal color scheme to keep the focus on the data. Venngage has a plethora of automated minimal color schemes, or you can craft your own for the infographic. Get started on your data infographic today!

