
Stock Infographics Template
Use this stock infographics template to show your company's growth, display data about your products/services, or the performance of a new offering.

 100% customizable templates
 Millions of photos, icons, charts and graphics
 AI-powered editing features
 Effortlessly share, download, embed and publish
 Easily generate QR codes for your designs
- Design stylemodern
- Colorslight
- SizeCustom (1000 x 1200 px)
- File typePNG, PDF, PowerPoint
- Planfree
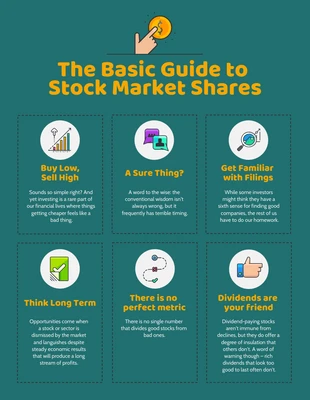
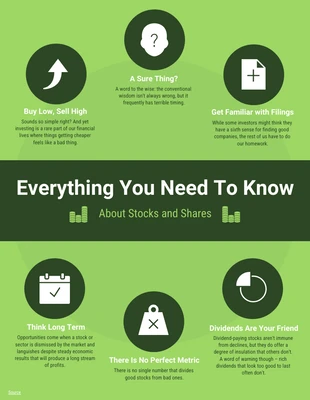
A stock infographic is a graphical representation of data or information, typically used to present complex information in a more easily digestible format. Stock infographics are often used by businesses and organizations to communicate data-driven stories or to put things into perspective by adding meaning to statistics. The information in a stock infographic should remain relevant over time and must be updated as necessary. Stock infographics can be an extremely powerful marketing or communication tool. Stock infographics can be used in a variety of contexts and purposes. It can be used to present data-heavy information in a more visually appealing and engaging way. It is often helpful when trying to communicate complex concepts or data sets. Also, stock infographics can be used as marketing or communication tools. They can help businesses and organizations promote their products, services, or brand. When used effectively, stock infographics can be a convincing way to reach new customers. When creating a stock infographic, choose the right data or information to include. The data or information should be relevant and interesting to your audience. It should also be something that
Related Infographic Templates
informational infographics
informational infographics
informational infographics
finance infographics
informational infographics
informational infographics
informational infographics
informational infographics
timeline infographics
finance infographics
informational infographics
finance infographics