
Colorful Minsk Gradient Science Infographic Template
Create a Science infographic by customizing and editing the Venngage Science infographic template.

 100% customizable templates
 Millions of photos, icons, charts and graphics
 AI-powered editing features
 Effortlessly share, download, embed and publish
 Easily generate QR codes for your designs
- Design stylefun
- Colorsvibrant
- SizeLetter (8.5 x 11 in)
- File typePNG, PDF, PowerPoint
- Planbusiness
A science infographic is a graphical way of displaying scientific data or information. It can be used to communicate complex ideas or concepts, to make data more accessible, or simply to make boring statistics more interesting! There are many different ways to create this infographic, but they all follow the same basic principle: using visuals to convey information in a more effective and engaging way. Science infographics can be used for a variety of purposes, from communicating scientific research to explaining complex concepts to a lay audience. They can be created by scientists, students, or anyone with an interest in science! Creating a science infographic is easy with Venngage's easy to follow step-by-step template. You don't need any design experience or special tools - just select the template you want to use and customize it to your liking! You can change the colors, fonts, and images to suit your needs, and add or remove sections as needed. This infographic template is also fully responsive, so it will look great on any device. The Venngage editor is a simple, drag-and-drop tool that anyone can
Related Infographic Templates
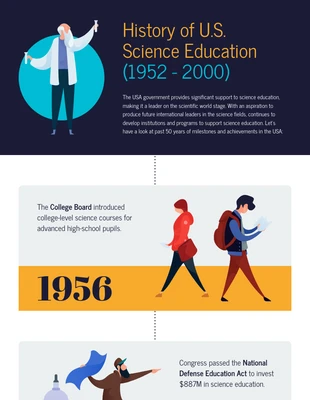
timeline infographics
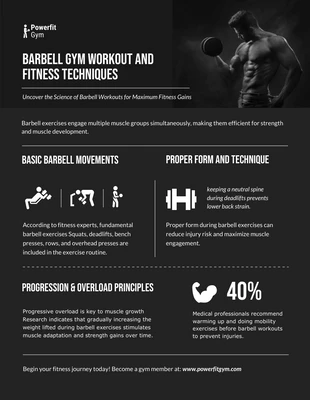
fitness infographics
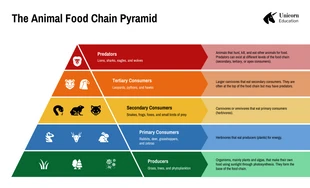
animal infographics
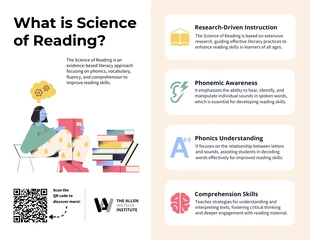
informational infographics
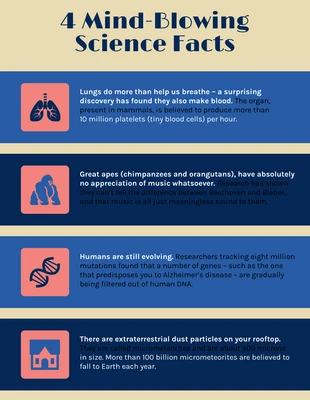
fun infographics
circle infographics
statistical infographics
informational infographics
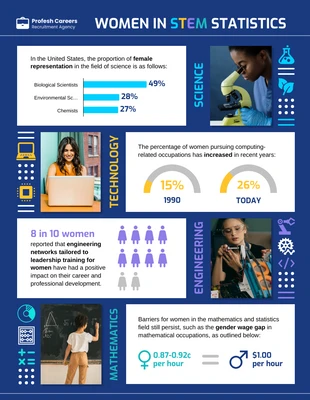
women infographics
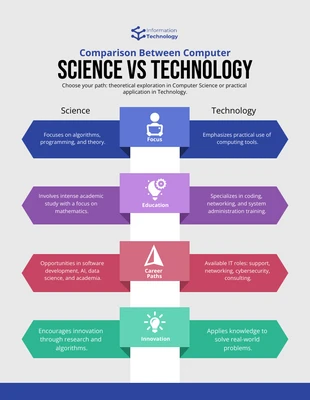
computer infographics
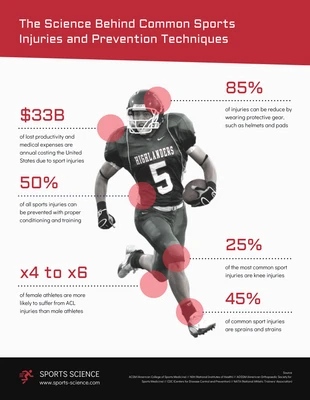
sports infographics
informational infographics