
Population Infographic Template
Create a population infographic with Venngage’s population infographic template.

 100% customizable templates
 Millions of photos, icons, charts and graphics
 AI-powered editing features
 Effortlessly share, download, embed and publish
 Easily generate QR codes for your designs
- Design stylemodern
- Colorslight
- SizeTabloid (17 x 11 in)
- File typePNG, PDF, PowerPoint
- Planfree
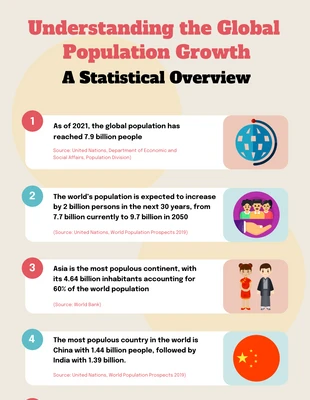
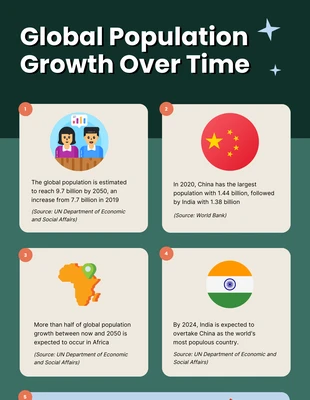
A population infographic is an image or chart that displays population data in an easy-to-understand way. They can be used to show population changes over time, population density, or other population-related information. Some key considerations when creating this infographic include choosing the right chart type for your data, selecting appropriate colors and fonts, and ensuring your infographic is visually appealing and easy to understand. When done correctly, population infographics can be an effective way to communicate population data to a wide audience. This type of infographic is used to visualize data such as population size, age, gender, and geographic location and can be used to show trends over time or to compare different populations. If you want to create an infographic that accurately represents data for a specific population, it's important to use a template that can be customized. This ensures that your infographic will look professional and that the information included is accurate. Your infographic should be accessible to as many people as possible. That means using language that is easy to understand, even for those who are not experts on
Related Infographic Templates
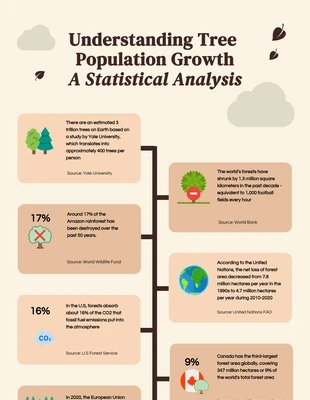
tree infographics
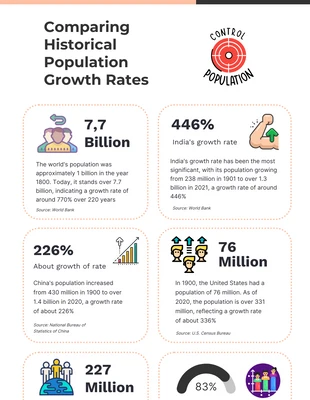
history infographics
people infographics
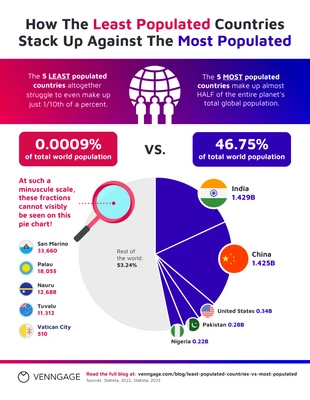
comparison infographics
people infographics
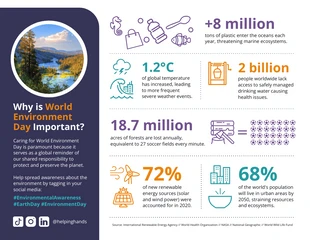
environment infographics
people infographics
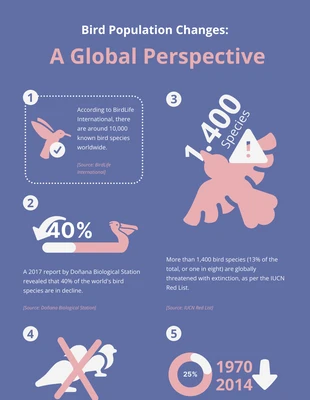
animal infographics
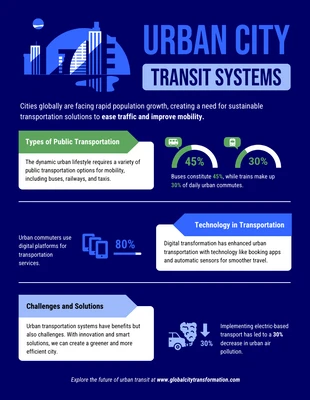
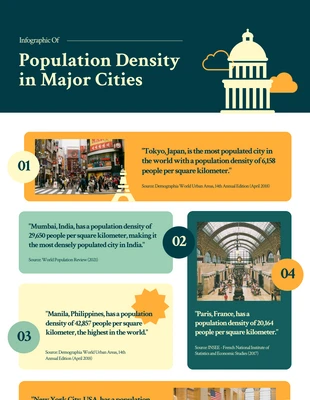
city infographics
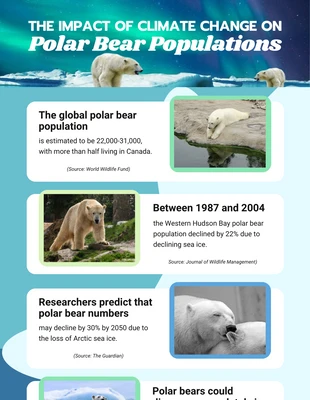
animal infographics
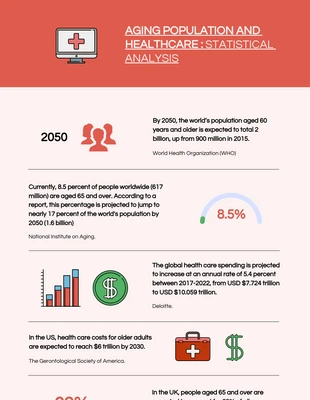
medical infographics
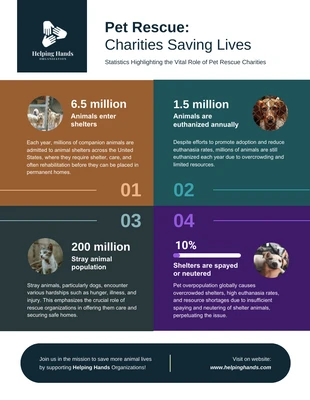
charity infographics