
Pie Chart Infographic Template
Want to create a pie infographic but you don’t have design experience? Edit and customize this infographic from Venngage with a few clicks.

 100% customizable templates
 Millions of photos, icons, charts and graphics
 AI-powered editing features
 Effortlessly share, download, embed and publish
 Easily generate QR codes for your designs
- Design stylemodern
- Colorslight
- SizeCustom (1300 x 816 px)
- File typePNG, PDF, PowerPoint
- Planfree
Pie infographics are a great way to show the variance of information in a simple and digestible format. They help users understand the big picture by breaking down complex information into small, easy-to-digest pieces. A pie chart is one of the most common types of infographics, and they're often used to visualize data related to topics like demographics, market research, or financials. Pie charts allow users to get an overview of their information quickly and easily without getting overwhelmed by all of the details at once. This makes them especially helpful for communicating complex data sets in an engaging way that's easy for anyone to understand - whether you're trying to explain how many people live in your town or how much money your company brought in last quarter! Plus, pie charts are just plain fun - who doesn't love colorful circles?! Fewer individuals possess the skills and knowledge required to develop a pie infographic with a professional appearance. This is the main reason we have made hundreds of templates at Venngage. Anyone can easily create their pie infographic using this template including
Related Infographic Templates
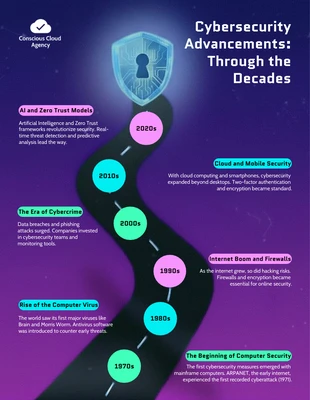
timeline infographics
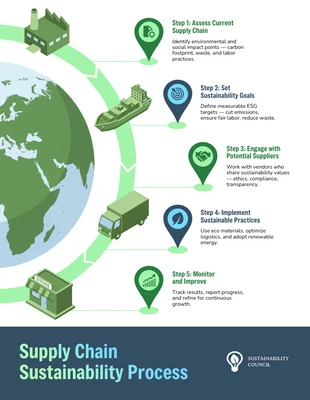
process infographics
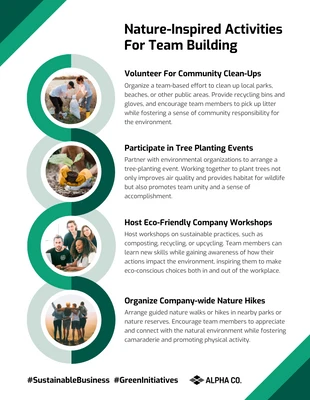
environment infographics

process infographics
environment infographics
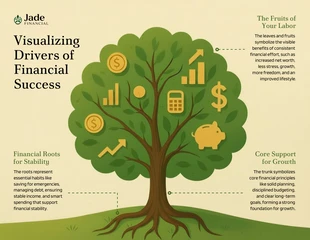
tree infographics
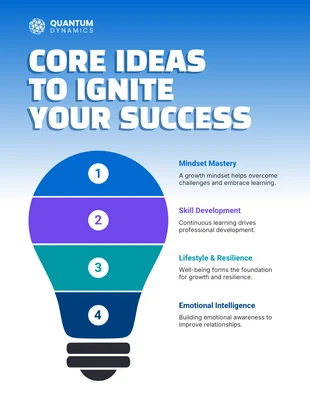
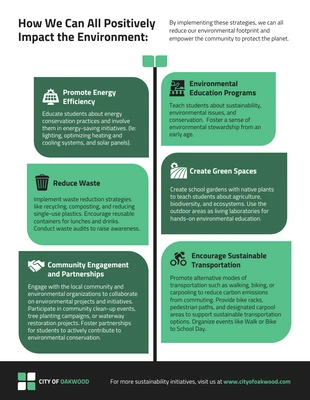
informational infographics
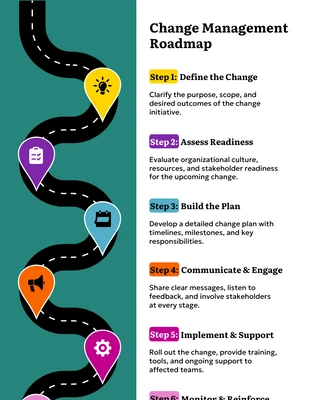
process infographics
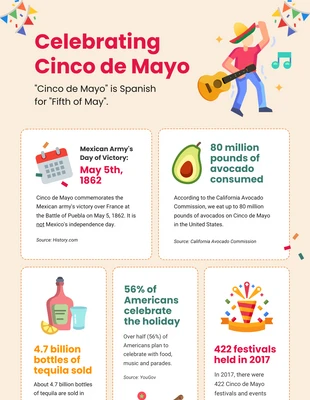
cinco de mayo infographics
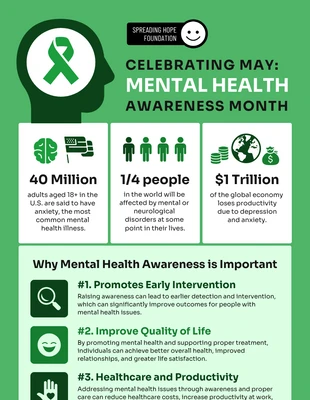
mental health infographics
informational infographics
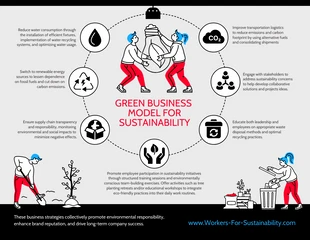
environment infographics