
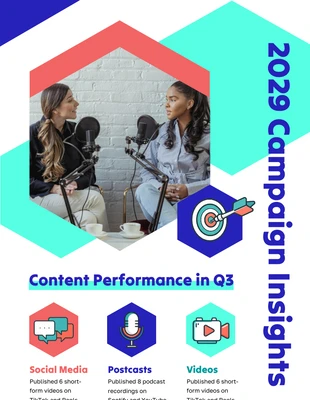
Percentage Infographic Generator Template
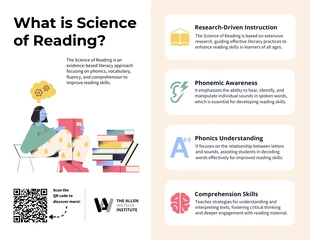
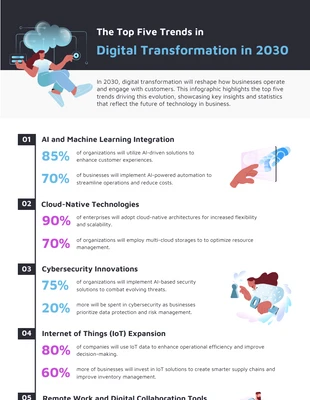
The "Percentage Infographic Generator Template" visually represents the distribution of various business roles, including Administrative, Operations, Sales and Marketing, Information Technology, Finance, and Human Resources. Each category is depicted with a percentage and corresponding icon for clarity. This template is ideal for business analysis and presentations. Customize it using our tool to fit your specific needs. Explore our library for more free templates to enhance your data visualization and communication efforts.

 100% customizable templates
 Millions of photos, icons, charts and graphics
 AI-powered editing features
 Effortlessly share, download, embed and publish
 Easily generate QR codes for your designs
- Design stylemodern
- Colorslight
- SizeLegal (14 x 8.5 in)
- File typePNG, PDF, PowerPoint
- Planbusiness
A percentage infographic is a great way to display numerical data in an easy-to-digest format. It is a graphical representation of percentage data. It can be used to show how a percentage has changed over time, or to compare percentages between different groups. Venngage makes it simple to create your own percentage infographic, and there are a variety of templates to choose from. Non-designers may easily create a professional-looking infographic without any design skills. All they have to do is put in the data and choose from a range of vibrant themes, after which you may quickly personalize it with your own design. To create your percentage infographic, start by clicking Create button. All you have to do now is figure out how to utilize the top editor panel, which gives you complete control. You may change everything from font styles, icon designs, color palettes, backgrounds, charts, and even the content itself. Venngage offers a variety of templates that are easy to use and customizable. Once you’ve chosen a template, start adding your data. Venngage makes it simple to add percentage data, and
Related Infographic Templates
informational infographics
health infographics
informational infographics
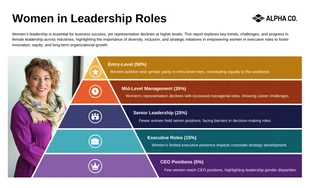
women infographics
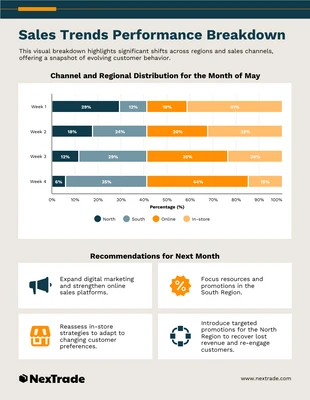
marketing infographics
marketing infographics
product infographics
health infographics
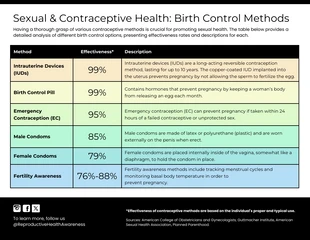
statistical infographics
statistical infographics
health infographics
research infographics