
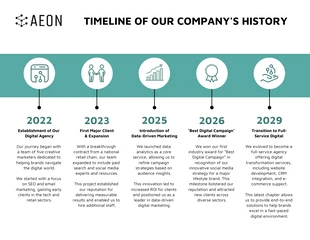
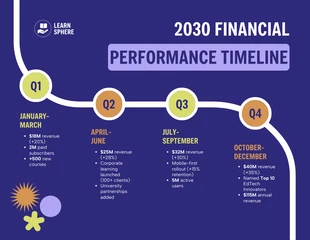
Picton Blue Gradient Monthly Timeline Infographic Template
Monthly Timeline infographic is a great solution to present your monthly report or even your blog content. Get started today!

 100% customizable templates
 Millions of photos, icons, charts and graphics
 AI-powered editing features
 Effortlessly share, download, embed and publish
 Easily generate QR codes for your designs
- SizeCustom (850 x 1810 px)
- File typePNG, PDF, PowerPoint
- Planpremium
The Monthly Timeline Infographic is a simple, clean, and easy-to-read infographic that can be used to create a visual representation of the timeline of events and activities within a month. It allows you to see at a glance whether your goals are being met on time, or if there are any gaps in your schedule. The Monthly Timeline Infographic shows you how much time you're spending on different activities—and what percentage of that time is spent on each activity. You can easily add new activities as necessary, remove existing ones, and reorder them as needed. You can also set reminders for yourself about upcoming events and tasks so that you don't forget anything important! Anyone who has trouble keeping track of their daily activities will benefit from using this template! One of the biggest challenges in creating infographics is the lack of formal experience in writing and designing. This skill is not something that you can learn overnight, and sometimes it might even take years for you to finally get the hang of it. If you don’t
Related Infographic Templates
timeline infographics
environment infographics
timeline infographics
timeline infographics
informational infographics
timeline infographics
library infographics
timeline infographics
timeline infographics
timeline infographics
process infographics
timeline infographics