Infographics And Data Visualization Infographic Template
Display essential information in a visual manner. Create an infographic by editing this infographics and data visualization template from Venngage.
Edit with AI
Let AI personalize this template instantly.
Edit manually
Make changes yourself.

100% customizable templates
Millions of photos, icons, charts and graphics
AI-powered editing features
Effortlessly share, download, embed and publish
Easily generate QR codes for your designs
- Design stylemodern
- Colorsdark, vibrant
- SizeCustom (816 x 2070 px)
- File typePNG, PDF, PowerPoint
- Planfree
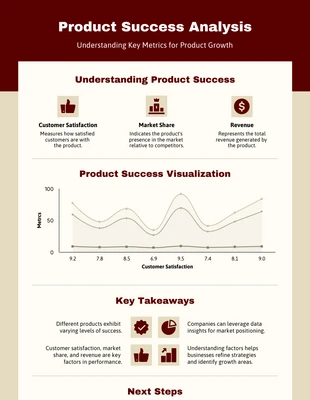
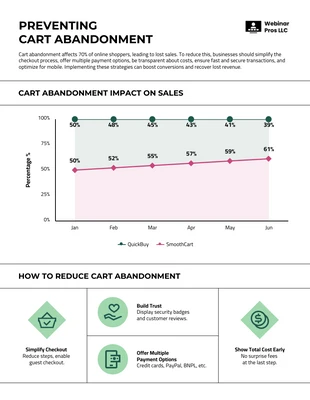
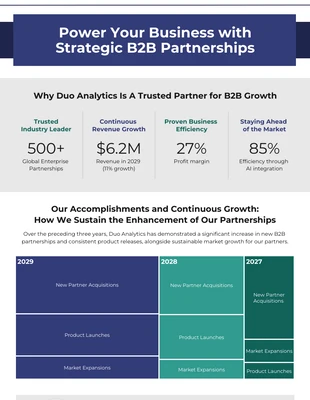
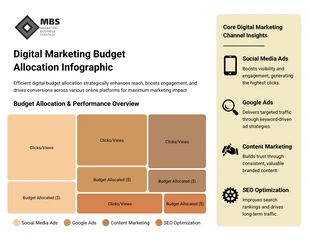
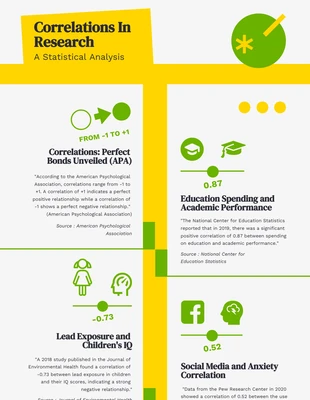
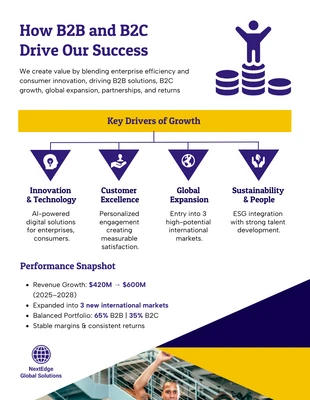
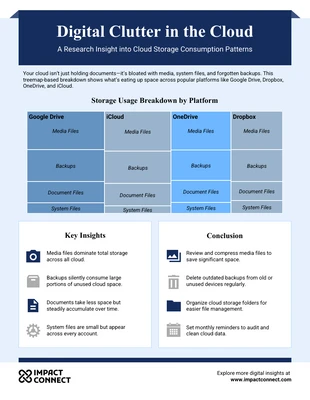
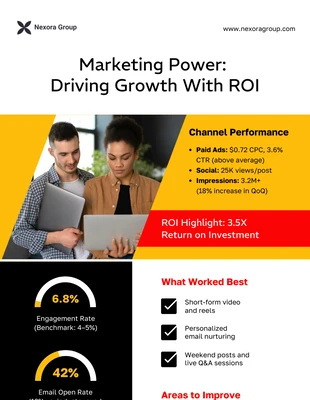
Make a stunning design for your statistical data with this infographics and data visualization template from Venngage. This infographic features engaging visuals such as shapes, images, color palettes, bold highlighted fonts, and statistical charts. Infographics are great tools for visually sharing statistics and data with your audience. Instead of filling your report with boring texts that are hard to read and memorize, you can use visuals using an infographic. A report filled with visualizations and images is easier to understand and remember. For this reason, Venngage’s infographics and data visualization template is a great way to communicate your information. Infographics are easier to understand and remember because of their visual nature. People are more likely to remember a chart or an image than long texts and complex numbers. If you want to impress your audience with your report or presentation, this infographics and data visualization template from Venngage can help you. You can quickly relay any information, statistic, or data to your intended audience by editing and customizing this infographic. Even without design experience, anyone can edit this infographic with just a
