
Gradient Project Timeline Infographic Template
Infographic With Timeline is a unique way to represent a timeline of events and activities for a specific month. Get started today for free.

 100% customizable templates
 Millions of photos, icons, charts and graphics
 AI-powered editing features
 Effortlessly share, download, embed and publish
 Easily generate QR codes for your designs
- SizeCustom (816 x 1920 px)
- File typePNG, PDF, PowerPoint
- Planbusiness
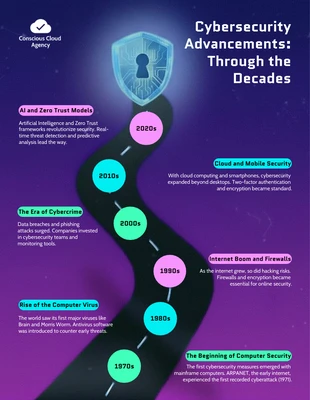
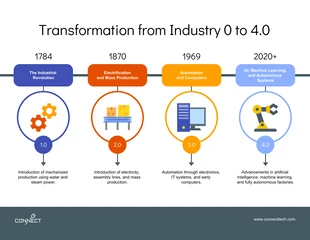
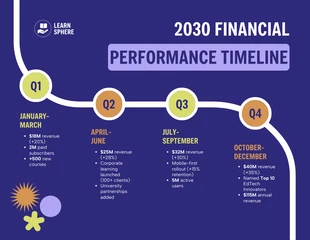
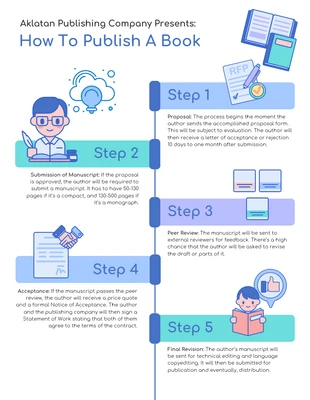
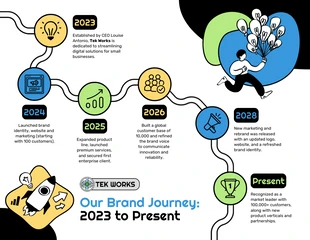
Infographic With Timeline is a powerful tool for visualizing and laying out data in an easy-to-read format. It can be used to lay out events chronologically, or as comparisons between time periods. The infographic can be used to show changes over time, and when used in conjunction with other tools, it can provide a visual depiction of trends and patterns. Infographic With Timeline provides users with a way to easily see how things change over time or how they compare to each other. Users don't have to read through long reports or spend hours looking at charts and graphs—instead, they can get all the information they need by looking at one simple graphic. It's also great for making information accessible for people who aren't familiar with certain types of data (for example, if you're working with sales figures for different regions). Infographics are usually easier for non-experts because they don't require any specialized knowledge on the user's part. One of the greatest ways to make marketing materials is using Venngage, thanks to its library of hundreds of
Related Infographic Templates
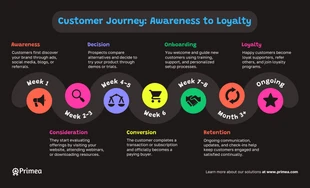
timeline infographics
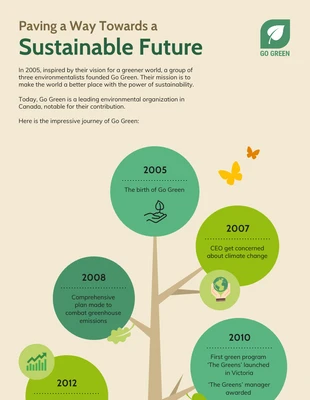
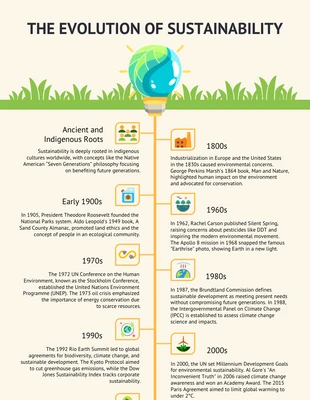
environment infographics
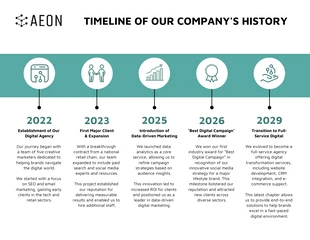
timeline infographics
timeline infographics
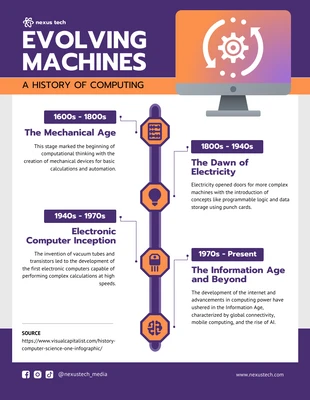
computer infographics
timeline infographics
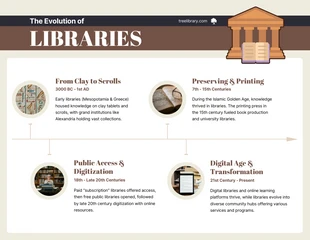
library infographics
timeline infographics
timeline infographics
timeline infographics
process infographics
timeline infographics