
Loan Product Services Numbers Infographic Template
Modify this infographic with numbers from Venngage. It display data in an easy-to-read way.

 100% customizable templates
 Millions of photos, icons, charts and graphics
 AI-powered editing features
 Effortlessly share, download, embed and publish
 Easily generate QR codes for your designs
- Design stylemodern
- Colorslight
- SizeCustom (900 x 1775 px)
- File typePNG, PDF, PowerPoint
- Planfree
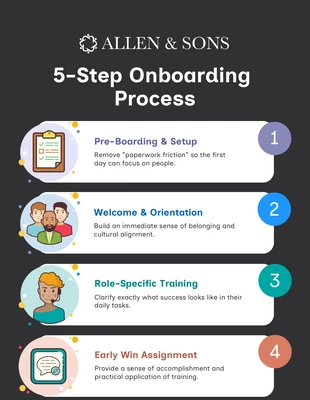
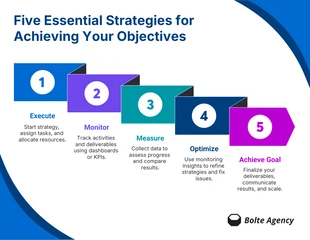
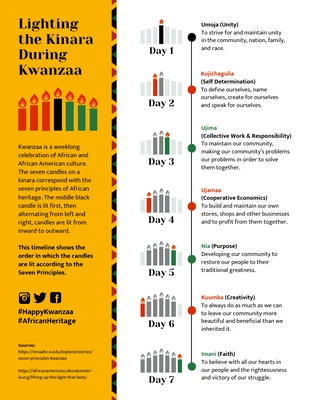
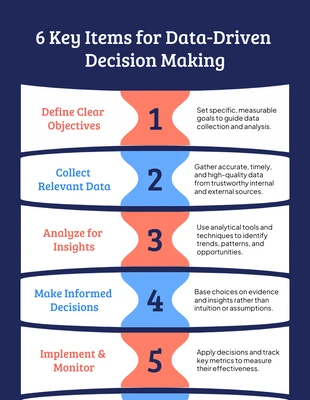
An infographic with numbers is a visual representation of data that can be used to help users understand the information easily. It helps them see the big picture, instead of having to read through a lot of text. Infographics are great for those who want to get their point across quickly, but don't have time to write long reports or papers. You can use this type of infographic in your business presentations or on your website if you're trying to sell something online. You can also share it on social media if you want people who aren't familiar with your product or service (or even if they are) to learn more about what they offer. An infographic with numbers is a simple way to present data. It’s also easy to create and share, which makes it a great way to get your message across. Infographics have been proven to be an engaging way for users to read content, and can help get your audience take action. The opportunity to create something visual without any design experience, skill or knowledge is a
Related Infographic Templates
human resources infographics

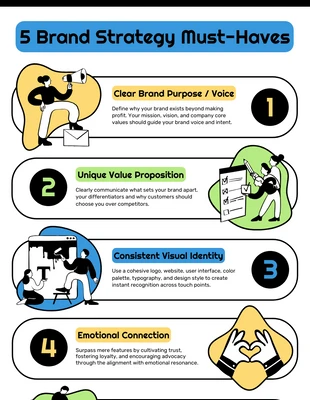
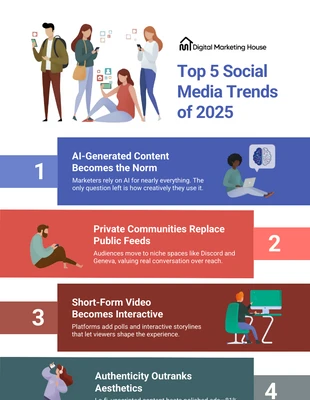
list infographics
list infographics

list infographics
timeline infographics
list infographics
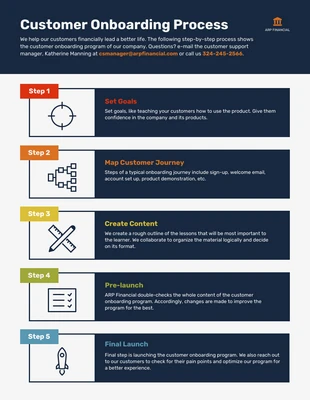
process infographics
list infographics
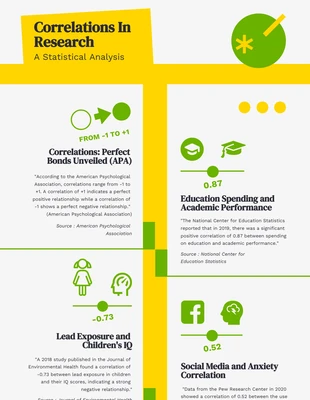
research infographics
list infographics

list infographics
list infographics