
Pastel Branding Guide Infographic Template
Present your information or market a business attractively. Create a pictorial infographic by editing this graphic infographic template.

 100% customizable templates
 Millions of photos, icons, charts and graphics
 AI-powered editing features
 Effortlessly share, download, embed and publish
 Easily generate QR codes for your designs
- Design stylefun, modern
- Colorsvibrant
- SizeCustom (816 x 1900 px)
- File typePNG, PDF, PowerPoint
- Planpremium
Infographics are graphic representations of data. They are used to express complex information quickly. Infographics come in various styles, but they all intend to make information easier to comprehend. You can design an infographic for all kinds of reasons. These include making a point, explaining a concept, comparing and contrasting data, providing step-by-step instructions, or promoting products. Whatever the reason, infographics can be an extremely effective tool for communicating detailed information. Some infographics use illustrations, photos, charts, or graphs to enhance the primary content. At the same time, some are dominated by visual elements with very little text. Graphic infographics are visual aids that rely heavily on colors, shapes, and pictures to convey information or effectively transmit a message. Most of the time, these infographics simplify complicated topics, making it easier for readers to understand the presented data. You can use graphically rich infographics for various purposes. They can visually represent data or knowledge, persuade people with information, explain complex concepts, and market a business using multiple graphics. Making graphic infographics may sound like a lot of work, primarily if you draw one from scratch.
Related Infographic Templates

process infographics

informational infographics
marketing infographics
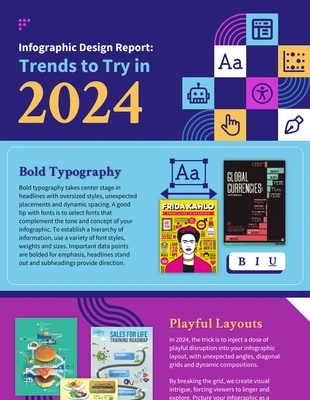
graphic design infographics
graphic design infographics
research infographics
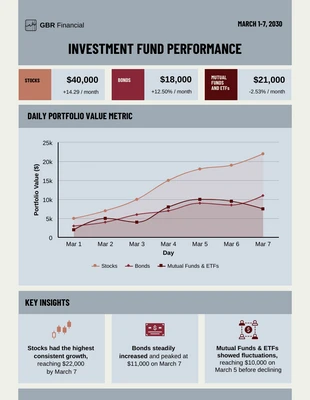
finance infographics
graphic design infographics

graphic design infographics
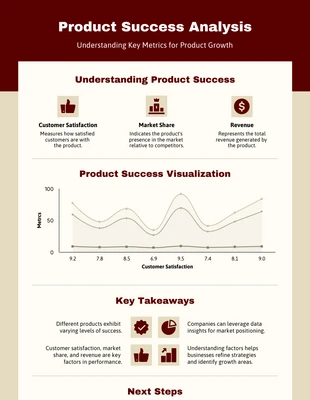
product infographics
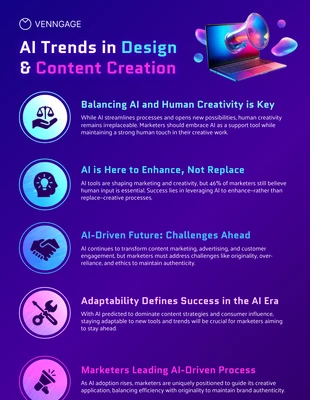
marketing infographics
tree infographics